. 2025 Jun 5;8(1):871.
doi: 10.1038/s42003-025-08283-6.

Phytic acid impairs macrophage inflammatory response in Echinococcus multilocularis infection

Affiliations

Phytic acid impairs macrophage inflammatory response in Echinococcus multilocularis infection

Manuel Salzmann et al. Commun Biol. .

Abstract

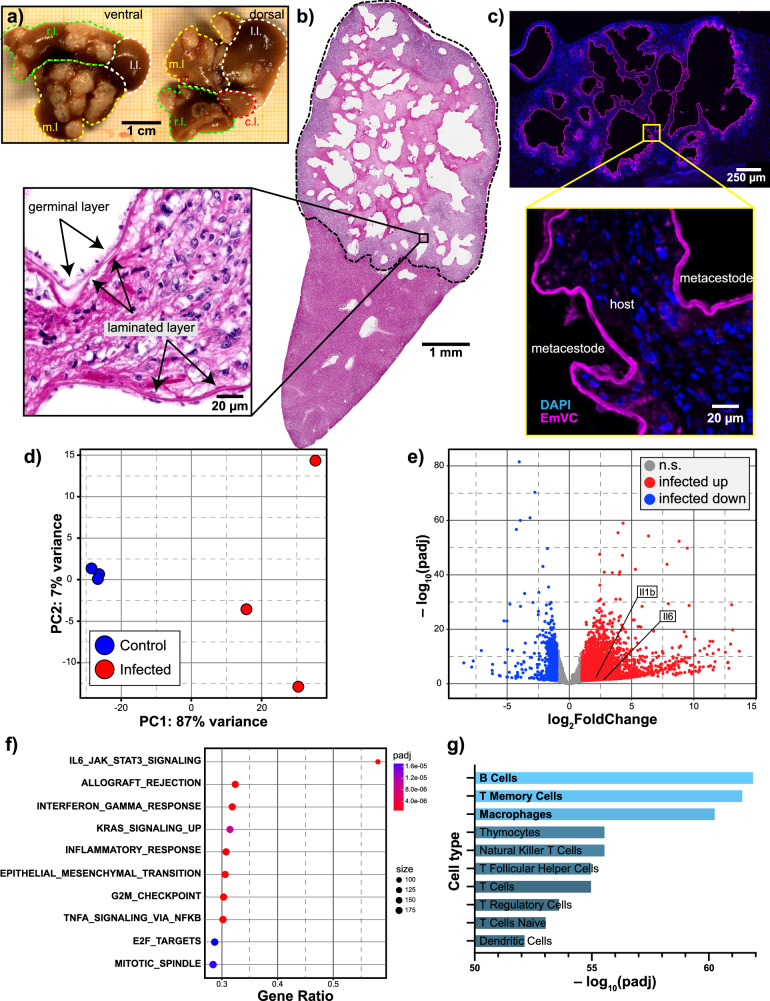
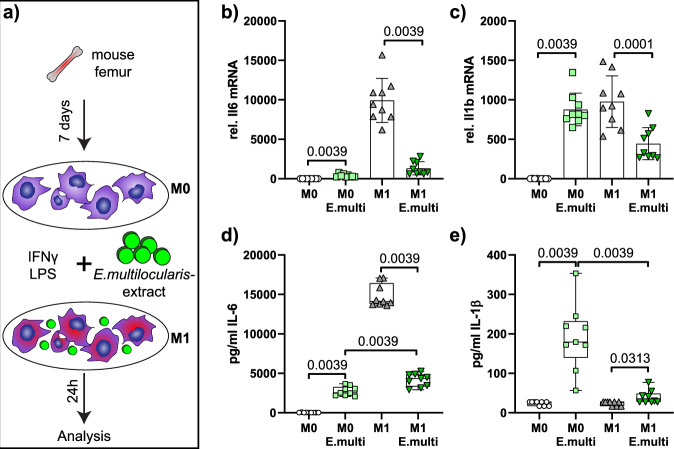
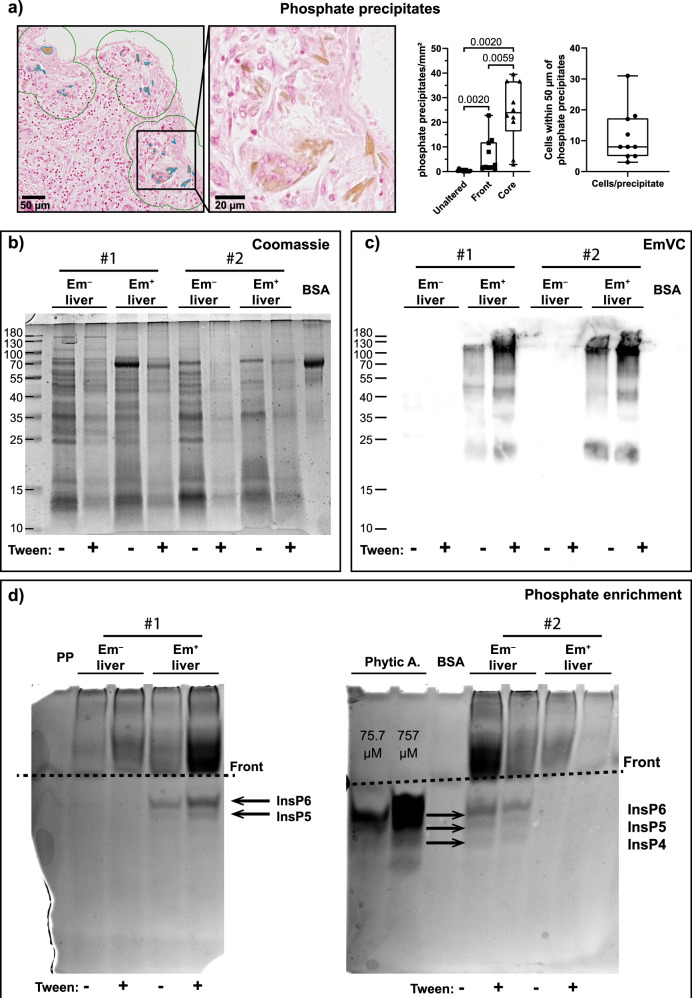
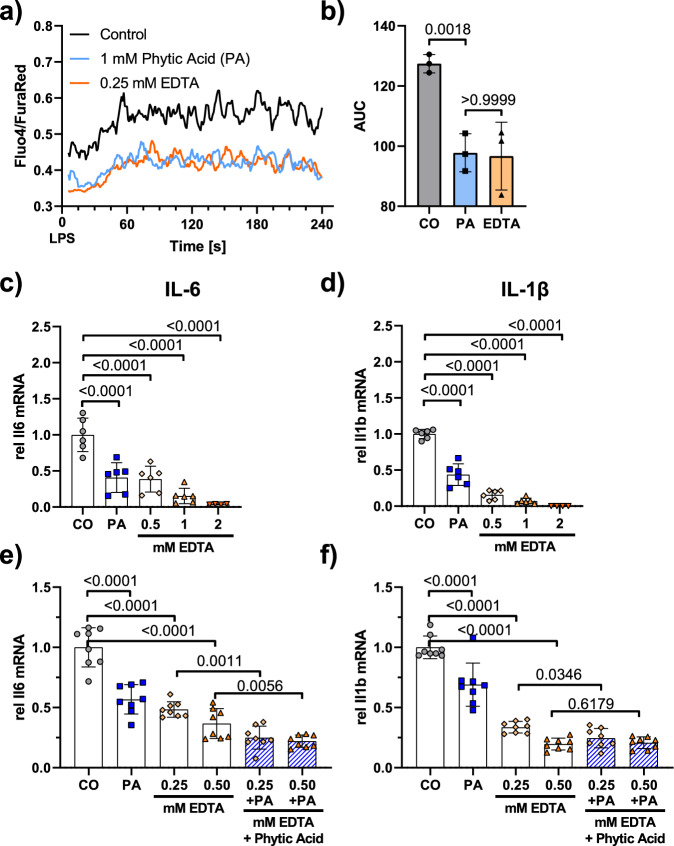
The helminth Echinococcus multilocularis relies on immune evasion strategies to persist within its host. The laminated layer (LL) surrounding the parasite provides physical protection while modulating host immune responses. E. multilocularis' immunomodulatory mechanisms are poorly understood and we explored the role of phytic acid, a known component of E. granulosus sensu lato. We show that phytic acid is also present in E. multilocularis-infected tissue and impairs macrophage inflammation. In vivo, inflammatory macrophages accumulate near the metacestode, yet do not express IL-6, indicating anti-inflammatory modulation. In vitro, phytic acid reduces pro-inflammatory cytokines such as IL-6 and IL-1β by lowering intracellular calcium levels in macrophages. This calcium-chelating effect is mirrored by the anti-inflammatory properties of an E. multilocularis metacestode extract, revealing a protein-independent immune modulation strategy. These findings suggest that phytic acid plays a crucial role in E. multilocularis' ability to suppress host immune responses and supports the parasite's long-term survival.


Conflict of interest statement

Competing interests: The authors declare that they have no competing interests.

Figures

Fig. 1
Fig. 1. Inflammatory response and immune cell infiltration in E. multilocularis infected murine livers.
a Representative image of an E. multilocularis infected C57BL/6JRj liver showing its ventral and dorsal side. Dotted lines depict the right lobe (r.l.) in green, left lobe (l.l.) in white, median lobe (m.l.) in yellow, and caudate lobe (c.l.) in red. b Hematoxylin and eosin stained, infected mouse liver section. The dotted black line indicates the site of parasite infection. The inset depicts the infection at higher magnification, with arrows pointing to the two layers of E. multilocularis: the host-adjacent acellular laminated layer and its inner cellular germinal layer. c Infected liver region with fluorescently labeled E. multilocularisi tissue. Blue, DAPI stained nuclei indicate host tissue, whereas the invading parasite metacestode is seen as black holes with magenta outlines. The inset with its higher magnification clearly depicts the Echinococcus metacestode within the host’s liver tissue. d Liver samples from three uninfected control and three infected female C57BL/6JRj mice were analyzed with bulk RNA sequencing. Plot of the first 2 dimensions of a principal component analysis, based on DESeq2 normalized count data. e Volcano plot showing differentially regulated murine liver genes of infected vs control livers. Y-Axis displays the negative log10 transformed padj, and x-axis shows log2 fold changes. Red dots represent ≥1-fold upregulated and blue dots ≤1-fold downregulated genes. Threshold for significance was padj ≤0.05. f Gene Set Enrichment Analysis (GSEA). Top 10 murine hallmark genes sets of infected vs control livers. The enriched terms are ranked by Gene Ratio and only significant (padj ≤ 0.05) pathways are listed in the panels. g Cell types that were associated with upregulated genes during E. multilocularis infection were identified with Enrichr and sorted according to -log10 (padj).
Fig. 2
Fig. 2. Localization of immune cells and IL-6 expression in E. multilocularis infected liver.
Unaltered liver tissue, metacestode front and metacestode core were analyzed separately. The first 90 µm metacestode bordering unaltered tissue were defined as its front. a Immune cells (CD45) in an E. multilocularis infected liver section. Average analysis per mouse: 8.38 mm² tissue. n = 10. b Antigen-presenting cells (CD74). Average analysis per mouse: 4.8 mm² tissue with 28,393 cells. c Macrophages (CD68). Average analysis per mouse: 13.07 mm² tissue with 71,819 cells. n = 10. d CD206high and (e) CD80 high cells. Average analysis per mouse: 12.00 mm² tissue with 68,225 cells. n = 10. f IL-6 expressing cells. Average analysis per mouse: 7.44 mm² tissue with 46,920 cells. n = 10. Five males and five females were analyzed. Paired t-test: (a–c), (d, e) front vs core; Wilcoxon test: (d, e Unaltered vs front, unaltered vs core; Mann–Whitney test: (f).
Fig. 3
Fig. 3. E. multilocularis impairs macrophage inflammatory response in vitro.
a Bone marrow derived macrophages (M0) were treated with E. multilocularis extract or PBS for 24 h, or treated with E. multilocularis extract or PBS during polarization with LPS and IFNγ to inflammatory macrophages (M1) for 24 h. Cellular mRNA expressions of (b) Il6 and (c) Il1b were quantified via the 2-ΔCt method and normalized to the respective mean of M0 control values. Mean ± SD, n = 10. Protein levels of (d) interleukin (IL) -6 and (e) IL-1β were measured from cell-free supernatant. n = 9. Paired t-test: c) M1 vs M1 multi; other comparisons: Wilcoxon test.
Fig. 4
Fig. 4. Phytic acid is enriched in E. multilocularis metacestodes.
a Von Kossa stained, E.multilocularis infected liver. Mustard stained phosphates are indicated with blue outlines. A 50 µm radius is indicated by green lines. The magnification indicates a specific tissue area with a multitude of phosphate precipitates identified as mustard colored areas. Unaltered liver tissue, metacestode front and metacestode core were analyzed separately. The first 90 µm metacestode bordering unaltered tissue were defined as its front. Phosphate precipitates per area were compared and cells within 50 µm radius of phosphates precipitates quantified. Average analyzed area per mouse: 25.2 mm². n = 10. Five males and five females were analyzed. Wilcoxon tests. b Coomassie staining of unaltered liver tissue (Em-) and metacestode-infected tissue (Em+) protein isolates, with or without Tween-20 to improve laminated and germinal layer extraction. c Western blot of E. multilocularis protein (EmVC vesicle crude antigen rabbit serum) in liver protein isolates, with or without Tween-20. d Detection of phytic acid (InsP6) in two gels after stepwise enrichment of germinal layer components with Tween and phosphate staining with Toluidine Blue. Phytic acid and its derivates run faster than the dye front during electrophoresis. Black arrows indicate phytic acid, InsP5, and InsP4. The dotted, black line indicates the dye front. BSA bovine serum albumin, PP polyphosphates.
Fig. 5
Fig. 5. Phytic acid (PA) mimics macrophage inflammatory response impairment of E. multilocularis in vitro.
Bone marrow derived macrophages (M0) were treated with 1 mM phytic acid or PBS and polarized with LPS and IFNγ to inflammatory macrophages (M1) for 24 h. Cellular mRNA expressions of (a) Il6 and (b), Il1b were quantified via the 2-ΔCt method and normalized to the respective mean of M0 control values. Mean ± SD, n = 9-10. Protein levels of (c) interleukin (IL) -6 and (d) IL-1β were measured from cell-free supernatant. n = 12. Paired t-test: (b) M1 vs M1 + PA; others: Wilcoxon test.
Fig. 6
Fig. 6. Phytic acid (PA) reduces inflammatory macrophage response by lowering intracellular calcium levels.
a Ratiometric, intracellular calcium measurements of inflammatory murine bone marrow derived macrophages (BMDM) with Fluo4 and FuraRed via flow cytometry. Cells were incubated with 1 mM phytic acid or 0.25 mM EDTA prior to calcium measurement. Mean, n = 3. b Area under the curve of ratiometric calcium time courses. Mean ± SD, n = 3. c BMDM macrophages were treated with PBS, 1 mM phytic acid, and the indicated concentrations of EDTA and polarized with LPS and IFNγ to inflammatory macrophages (M1) for 24 h. mRNA expression of Il6 and (d) Il1b were quantified via the 2-ΔCt method and normalized to the respective mean of M1 control values. Mean ± SD, n = 4–6. e BMDM macrophages were treated with PBS, 1 mM phytic acid, the indicated concentrations of EDTA, and 1 mM phytic acid in combination with EDTA for 24 h. Cells were then polarized with LPS and IFNγ to inflammatory macrophages (M1) for 24 h. mRNA expression of Il6 and (f) Il1b were quantified via the 2-ΔCt method and normalized to the respective mean of M1 control values. Mean ± SD, n = 8. Paired t-test: (b) CO vs PA; (e, f) EDTA vs EDTA+ Phytic acid; Wilcoxon test: (b) PA vs EDTA; 1-way ANOVA: (c, d); (e, f) vs CO.

References

    1. Romig, T. et al. Ecology and life cycle patterns of Echinococcus species. Adv. Parasitol.95, 213–314 (2017). - PubMed
    1. Kern, P. et al. The Echinococcoses. Diagnosis, Clin. Manag. Burd. Dis. Adv. Parasitol.96, 259–369 (2017). - PubMed
    1. Gottstein, B. et al. An intact laminated layer is important for the establishment of secondary echinococcus multilocularis infection. Parasitol. Res.88, 822–828 (2002). - PubMed
    1. Folle, A. M. et al. Modulatory actions of echinococcus granulosus antigen B on macrophage inflammatory activation. Front Cell Infect. Microbiol14, 1362765 (2024). - PMC - PubMed
    1. Sagasti, C., Casaravilla, C., Fernandez, C., Flo, M. & Diaz, A. Inhibition of inflammatory cytokine production and proliferation in macrophages by Kunitz-type inhibitors from echinococcus granulosus. Mol. Biochem Parasitol.242, 111351 (2021). - PubMed