. 2025 Jun 5;8(1):869.
doi: 10.1038/s42003-025-08305-3.

Loss of state transitions in Bryopsidales macroalgae and kleptoplastic sea slugs (Gastropoda, Sacoglossa)

Affiliations

Loss of state transitions in Bryopsidales macroalgae and kleptoplastic sea slugs (Gastropoda, Sacoglossa)

Vesa Havurinne et al. Commun Biol. .

Abstract

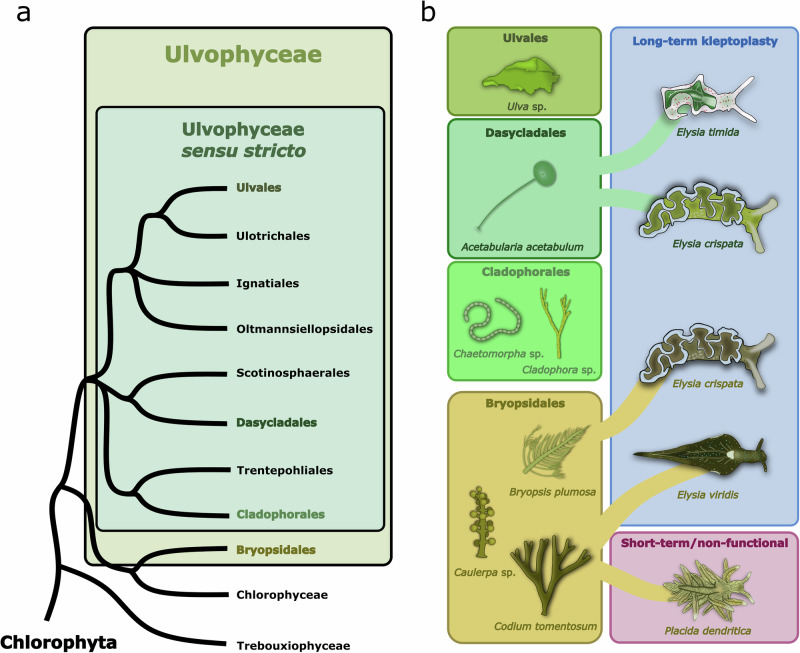
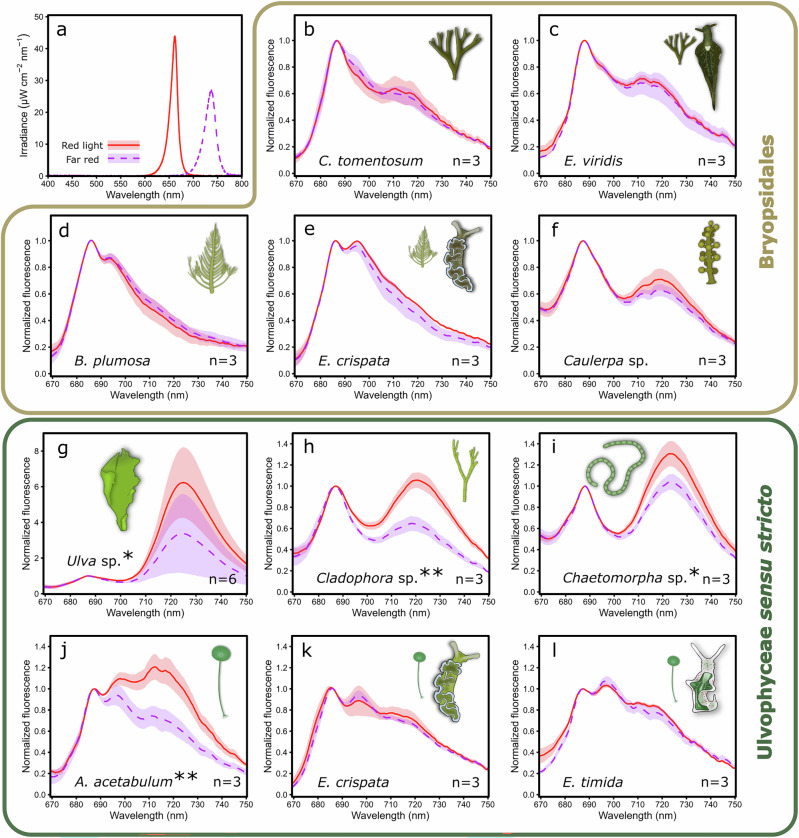
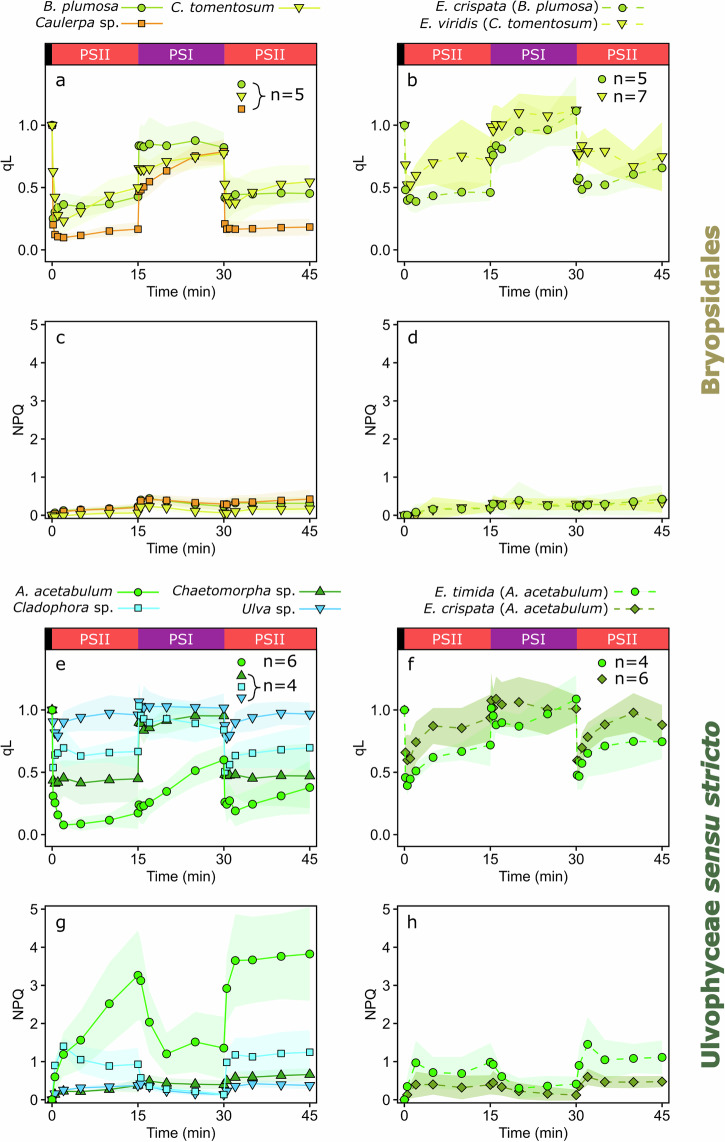
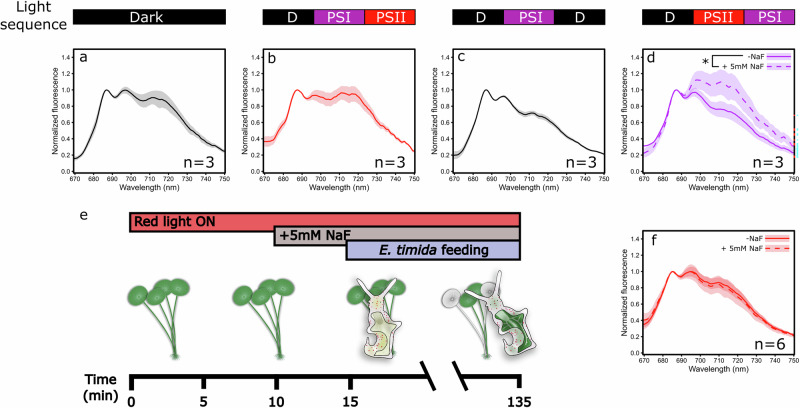
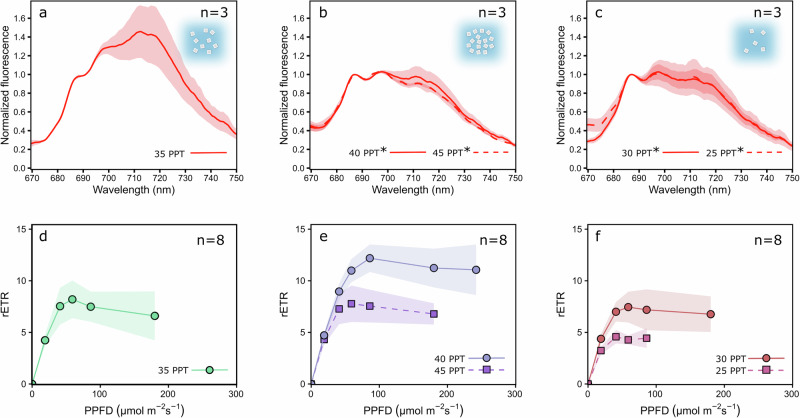
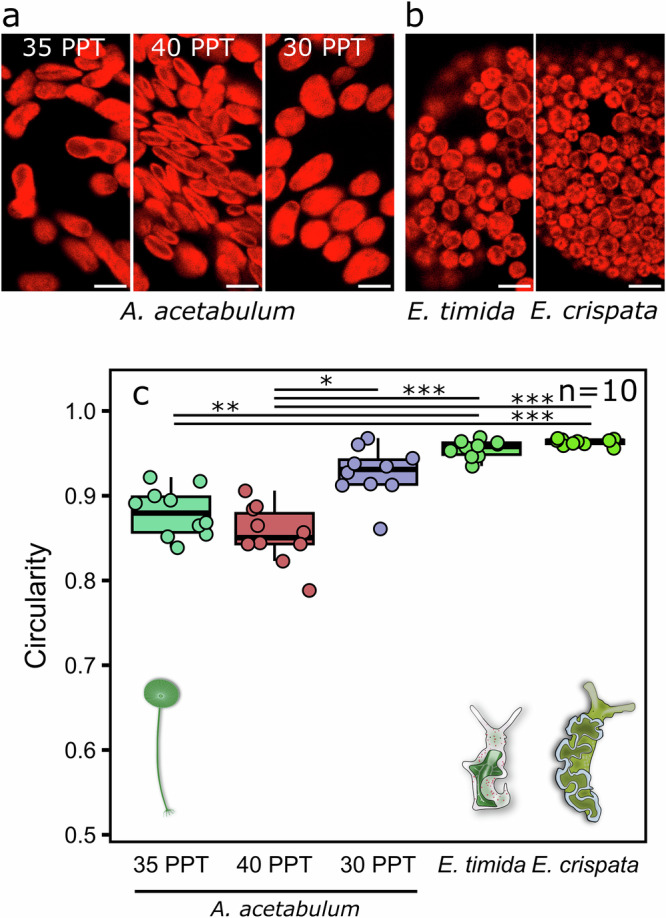
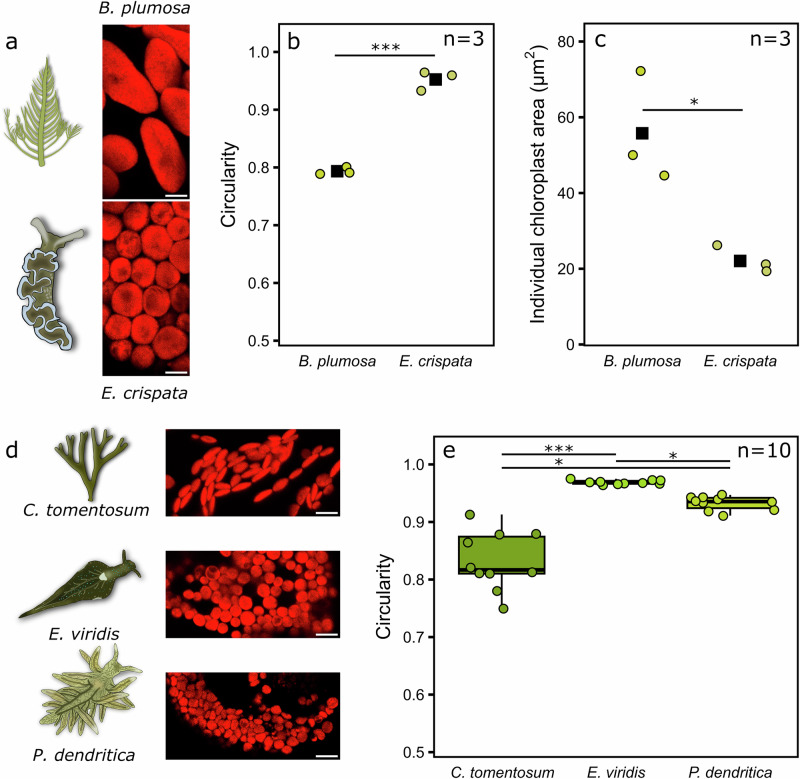
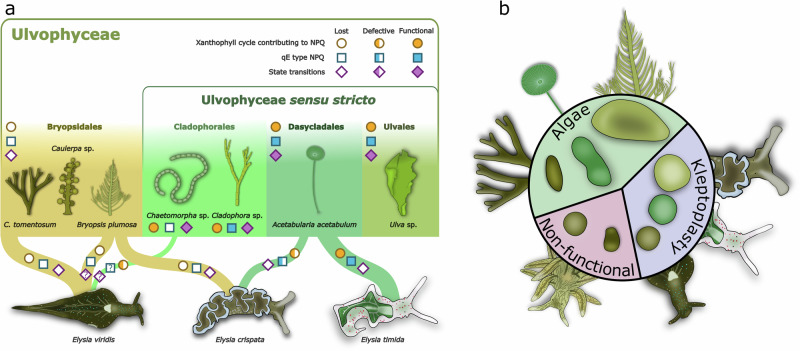
Green macroalgae within the order Bryopsidales lack the fundamental photoprotective mechanisms of green algae, the xanthophyll cycle and energy-dependent dissipation of excess light. Here, by measuring chlorophyll fluorescence at 77 K after specific light treatments, we show that Bryopsidales algae also lack state transitions, another ubiquitous photoprotection mechanism present in other green algae. Certain Sacoglossa sea slugs can feed on Ulvophyceae algae, including some Bryopsidales, and steal chloroplasts - kleptoplasts - that remain functional inside the animal cells for months without the support of the algal nucleus. Our data reveal that the state transition capacity is not retained in the kleptoplasts of the sea slugs, and we provide evidence that the loss is caused by structural changes during their incorporation by the animals. Enforced chloroplast sphericity was observed in all studied kleptoplastic associations, and we propose that it is a fundamental property supporting long-term retention of kleptoplasts in photosynthetic sea slugs.


Conflict of interest statement

Competing interests: The authors declare no competing interests. Ethics approval: This study was performed in accordance with EU legislation and directives concerning scientific research on animals, including the 3 R principles. Ethical approval is not required for studies conducted with non-cephalopod invertebrates. Wild algae and sea slugs were collected from non-protected marine coastal areas. Laboratory-reared specimens used in this work were maintained in optimized life-support systems to ensure animal welfare.

Figures

Fig. 1
Fig. 1. The Ulvophyceae algae and the sacoglossan sea slugs feeding on them.
a A cladogram of Ulvophyceae showing the relationship between Bryopsidales and the core set of ulvophytes (Ulvophyceae sensu stricto), based on the classification by Hou et al.. According to the traditional nomenclature, the class Ulvophyceae also includes Bryopsidales. b The sea slugs Elysia timida, Elysia crispata, and Elysia viridis are capable of long-term kleptoplasty. E. timida only feeds on and incorporates chloroplasts from Acetabularia acetabulum as kleptoplasts, but E. crispata and E. viridis are known to obtain kleptoplasts from multiple sources, including algae belonging to the group Bryopsidales. Here, only the algae-sea slug associations tested in this study are shown. Like E. viridis, Placida dendritica also feeds on Codium tomentosum, but it only stores the kleptoplasts very transiently, and they are non-functional.
Fig. 2
Fig. 2. State transitions in Ulvophyceae and kleptoplastic sea slugs with kleptoplasts originating from different ulvophyte algae.
a The spectra of the red PSII (red, solid line) and far-red PSI (purple, dashed line) specific lights used for the 15 min illumination (PPFD 50 µmol m−2 s−1) of the samples to induce light acclimation state 2 or state 1, respectively. bl 77 K chlorophyll fluorescence of samples treated with red PSII (solid line) or far-red PSI light (dashed line). bf Normalized 77 K fluorescence spectra in ulvophyte algae belonging to the Bryopsidales order (b, d, f) and in the sea slugs c Elysia viridis and e Elysia crispata possessing kleptoplasts derived from Codium tomentosum or Bryopsis plumosa, respectively. gl Normalized 77 K fluorescence in ulvophyte algae belonging to g Ulvales, h, i Cladophorales, and j Dasycladales, as well as in the sea slugs k E. crispata and l Elysia timida that possess kleptoplasts derived from Acetabularia acetabulum. Excitation light was 450 nm in all fluorescence measurements. The number of biological replicates (n) is shown in the panels. The shaded areas around the curves show standard deviation. Significant differences in normalized PSI fluorescence between the light treatments are indicated with asterisks next to the species names (Student’s t-test, *p value < 0.05, ** < 0.01).
Fig. 3
Fig. 3. Openness of PSII reaction centers (qL) and non-photochemical quenching (NPQ) kinetics in Ulvophyceae algae and kleptoplastic sea slugs during illumination with wavelengths favoring PSII and PSI.
a, b qL and c, d NPQ in Bryopsidales algae and the sea slugs Elysia crispata and Elysia viridis with Bryopsidales-derived kleptoplasts, as indicated in the legends. eh The same parameters in true ulvophyte algae and the sea slugs Elysia timida and E. crispata containing kleptoplasts originating from the true ulvophyte Acetabularia acetabulum. The black, red, and purple bars on top of the top panels describe the low light (PPFD ~ 10 µmol m−2 s−1), red PSII light, and far-red PSI light treatments (PPFD 50 µmol m−2 s−1) during the experiments. For the spectra of PSII and PSI lights, see Fig. 2. qL and NPQ were determined by saturating light pulse analyses with a PAM fluorometer, and their definitions are described in the “Methods” section. The lines show the means from the biological replicates, and the colored areas around the curves indicate standard deviation. The number of biological replicates (n) is shown in the panels.
Fig. 4
Fig. 4. Dynamics of state transitions in Acetabularia acetabulum and the forced light state 1 of Elysia timida kleptoplasts.
Chlorophyll fluorescence at 77 K measured from A. acetabulum samples that were a kept in the dark, b illuminated with 740 nm far-red PSI and 660 nm red PSII lights (PPFD 50 µmol m−2 s−1) after darkness, c kept in the dark, illuminated with PSI light and put to dark again, and d illuminated with PSII and PSI light in sequence after darkness ±5 mM sodium fluoride (NaF), added after the samples had been in PSII light for 10 min. The bars on top of the (ad) indicate the light sequence the samples were exposed to prior to sampling. Each dark or light bar represents a 15 min period. e Schematic of the feeding experiment, where previously bleached E. timida individuals were allowed to feed on A. acetabulum cells pre-illuminated with PSII light for 15 min (to induce state 2) prior to releasing the bleached sea slugs to feed. To prevent dephosphorylation-dependent state 2 to 1 transition in half of the samples, 5 mM NaF was added after 10 min of the PSII light treatment, and the bleached sea slugs were added 5 min later to feed on the algae in the presence of NaF. Sea slugs that had turned noticeably green were sampled at different times throughout the 120-min feeding time. The sea slugs and the algae were continuously illuminated with red PSII light during the entire experiment. f 77 K chlorophyll fluorescence of E. timida from the experiment described in (e), ±NaF, as indicated. Excitation light was 450 nm in all fluorescence measurements. The lines show the mean and standard deviation is indicated by the shaded areas around the curves. The number of biological replicates (n) is shown in the panels. Significant differences in normalized PSI fluorescence between the ±NaF treatments are indicated with an asterisk (Student’s t-test, *p value < 0.05).
Fig. 5
Fig. 5. The effect of salinity changes on state transitions and photosynthetic electron transfer in Acetabularia acetabulum.
a 77 K fluorescence of A. acetabulum samples after exposure to 20 min of red PSII light (PPFD 50 µmol m−2 s−1) in ASW with a salinity of 35 PPT (control). 77 K fluorescence from A. acetabulum treated identically to the samples used in (a), except for a switch to higher (40 or 45 PPT, b) or lower salinity (30 or 25 PPT, c) for the final 5 min of the 20 min PSII light treatment. The asterisks next to the salinity descriptions in (b, c) mark significant differences in normalized PSI fluorescence between the indicated salinity treatments and the 35 PPT treatment in (a) (one-way ANOVA followed by post-hoc Tukey’s test, *p value < 0.05). df Relative electron transfer rate (rETR) of A. acetabulum measured with a PAM fluorometer after a 5 min treatment in growth conditions in the salinities described in the panel legends. The illumination at each PPFD lasted 60 s before determining rETR with a saturating light pulse, and rETR values are only shown down to the light intensity where the rETR was above zero in all replicates. The number of biological replicates (n) is shown in the panels. The shaded areas around the curves show standard deviation.
Fig. 6
Fig. 6. The circularity of Acetabularia acetabulum chloroplasts before and after osmotic shocks and kleptoplastic incorporation by photosynthetic sea slugs, imaged with confocal microscopy using chlorophyll a fluorescence.
Exemplary images from a A. acetabulum in ASW with different salinities, 35 PPT being the growth condition, or from b sea slugs Elysia timida and Elysia crispata with A. acetabulum-derived kleptoplasts. The scale bars are 5 µm in all representative images in (a, b), and brightness and contrast adjustments were applied to the entire images for visual purposes. c The circularity of the chloroplasts in the different salinity treatments of A. acetabulum and the sea slugs, calculated as (4π × Chloroplast Area)/Chloroplast Perimeter2, where the value for individual chloroplasts varies between 0 (not a circle) and 1 (a perfect circle). Each individual datapoint shows the median chloroplast circularity from a single biological replicate (calculated from hundreds to thousands of identified chloroplasts), whereas the box plots show the medians and interquartile ranges from all replicates. The number of biological replicates (n) is shown in (c). The whiskers indicate non-outlier maxima and minima. Asterisks mark significant differences between the indicated treatment groups (Kruskal–Wallis, followed by post-hoc Dunn’s test, *p value < 0.05, ** < 0.01, *** < 0.001).
Fig. 7
Fig. 7. The shapes and sizes of Bryopsidales chloroplasts in the algae and inside the kleptoplastic sea slugs.
a Chloroplast imaging with a confocal microscope using chlorophyll a fluorescence from the alga Bryopsis plumosa itself (top), and after kleptoplastic incorporation into Elysia crispata cells (bottom). b The circularity of the chloroplasts in B. plumosa and in the sea slug E. crispata. c An estimation of the individual chloroplast area for the chloroplasts in B. plumosa and E. crispata. The circles and black squares show the individual data points (the median chloroplast circularity or area from a single biological replicate) and their mean values, respectively, in (b, c). d Exemplary confocal microscope images of Codium tomentosum chloroplasts inside the alga C. tomentosum (top), the kleptoplastic sea slug Elysia viridis (middle), and the sea slug Placida dendritica that is not capable of functional kleptoplasty (bottom). e The circularity of the chloroplasts in C. tomentosum and in the two sea slug species. The circularity was calculated as (4π × Chloroplast Area)/Chloroplast Perimeter2, where the value for an individual chloroplast varies between 0 (not a circle) and 1 (a perfect circle). In (e), each individual datapoint shows the median chloroplast circularity or area from a single biological replicate (calculated from hundreds to thousands of identified chloroplasts). The box plots show the medians and interquartile ranges from all biological replicates. The number of biological replicates (n) is shown in the panels. The whiskers indicate non-outlier maxima and minima. The asterisks mark significant differences between the indicated groups, determined by Student’s t-test for (b, c) and Kruskal–Wallis, followed by Dunn’s test for (e) (*p value < 0.05, *** < 0.001). The scale bars are 5 µm in all representative images in (a, d), and brightness and contrast adjustments were applied to the entire images for visual purposes.
Fig. 8
Fig. 8. Summary of the major differences in photoprotection, light acclimation, and chloroplast shapes between Bryopsidales, other ulvophytes, and both functional and non-functional kleptoplastic sea slugs hosting the kleptoplasts derived from ulvophyte macroalgae.
a The existence and functionality of the xanthophyll cycle contributing to non-photochemical quenching (NPQ), the energy-dependent qE component of NPQ, and state transitions in Ulvophyceae and the kleptoplastic sea slugs feeding on different ulvophytes. The differently colored circles and squares describe the different levels of the xanthophyll cycle and qE, respectively, in different algal groups/sea slugs, as described in Christa et al. and Morelli et al.,, and here for Chaetomorpha sp. The occurrence of state transitions is indicated by the differently colored diamonds and relies solely on the data from the present study. Question marks indicate untested properties. The thickness of a node connecting an alga and a sea slug approximates the strength of the prey-predator relationship of the species in our laboratory conditions. The division of Ulvophyceae macroalgae to the core set of ulvophytes (Ulvophyceae sensu stricto) and to Bryopsidales (see Fig. 1) is based on the classification by Hou et al.. b The chloroplasts inside the ulvophyte macroalgae show highly varied shapes, whereas the kleptoplasts inside the sea slugs are nearly perfect spheres. Sea slugs that are incapable of functional kleptoplasty have less circular kleptoplasts than slugs with functional kleptoplasty.

Similar articles

Cited by

References

    1. Rumpho, M. E., Pelletreau, K. N., Moustafa, A. & Bhattacharya, D. The making of a photosynthetic animal. J. Exp. Biol.214, 303–311 (2011). - PMC - PubMed
    1. de Negri, A. & de Negri, G. Farbstoff aus Elysia viridis. Ber. Dtsch. Chem. Ges.9, 84 (1876).
    1. Cruz, S. & Cartaxana, P. Kleptoplasty: getting away with stolen chloroplasts. PLoS Biol.20, e3001857 (2022). - PMC - PubMed
    1. Christa, G. Kleptoplasty. Curr. Biol.33, R465–R467 (2023). - PubMed
    1. Bhattacharya, D., Pelletreau, K. N., Price, D. C., Sarver, K. E. & Rumpho, M. E. Genome analysis of Elysia chlorotica egg DNA provides no evidence for horizontal gene transfer into the germ line of this kleptoplastic mollusc. Mol. Biol. Evol.30, 1843–1852 (2013). - PMC - PubMed

LinkOut - more resources