. 2025 Sep;9(9):1887-1897.
doi: 10.1038/s41562-025-02191-9. Epub 2025 Jun 5.

Protracted development of gaze behaviour

Affiliations

Protracted development of gaze behaviour

Marcel Linka et al. Nat Hum Behav. 2025 Sep.

Abstract

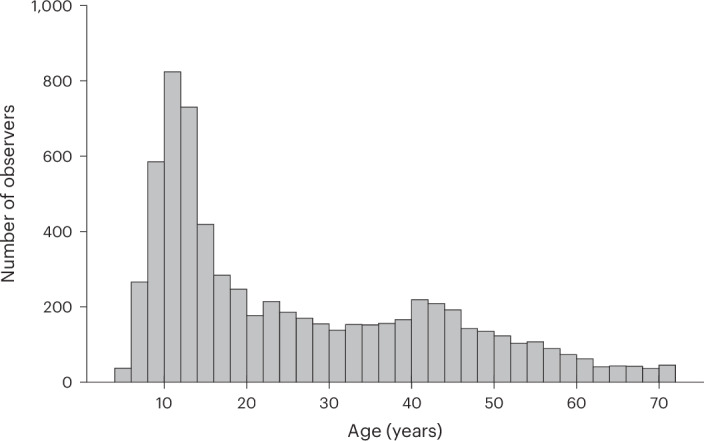
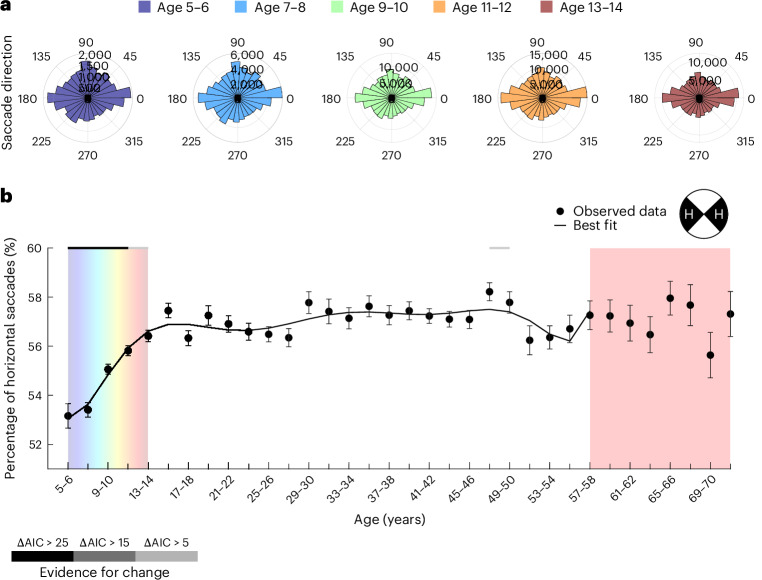
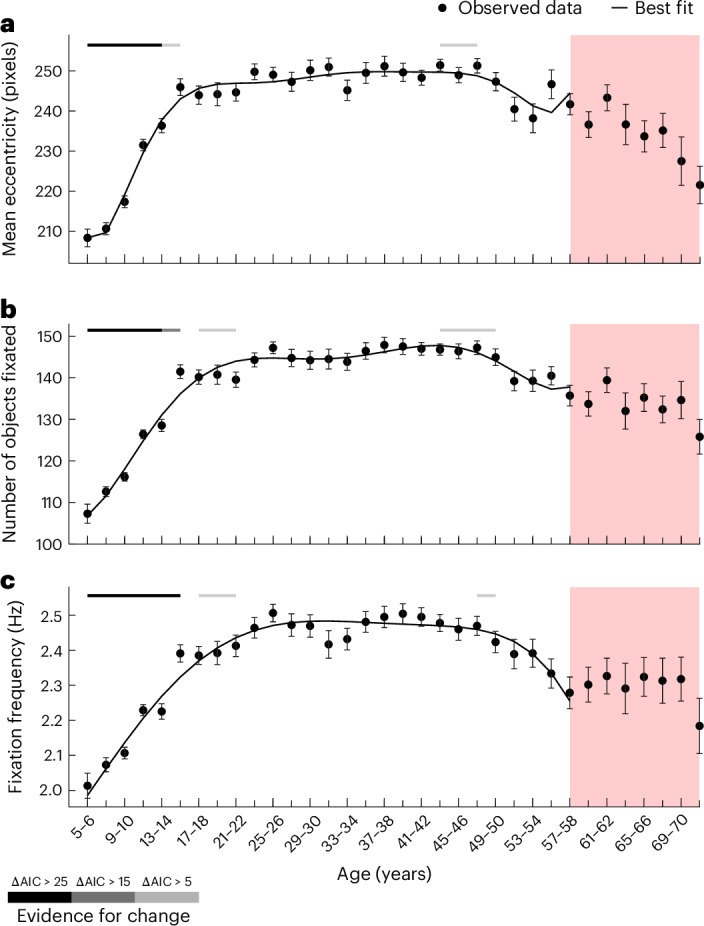
How does scene viewing develop? Previous evidence is limited and suggests that viewing behaviour may be adult-like from about eight years old. Here we present data from n = 6,720 participants from 5 to 72 years old, freely viewing 40 natural scenes. We found that the development of scene viewing is surprisingly protracted. Semantic salience for social features continuously changes until adolescence, and text salience increases over the first two decades of life. Basic oculomotor biases towards the image centre and along the horizontal meridian develop until adolescence, matching developmental changes in visual sensitivity and cortex. Finally, while the tendency for visual exploration continuously increases, fixation patterns become less idiosyncratic and more canonical throughout adolescence. These findings show that fundamental aspects of adult gaze take up to two decades of continuous development and push individuals towards more canonical viewing patterns. We suggest that development is key to understanding the general mechanisms of active vision.


Conflict of interest statement

Competing interests: The authors declare no competing interests.

Figures

Fig. 1
Fig. 1. Eye-tracking booth and procedure.
a, The eye-tracking booth exhibited at Mathematikum. b, Overview of the experimental procedure (ITI refers to inter-trial interval). For a more detailed description of the software, please refer to Supplementary Fig. 1.
Fig. 2
Fig. 2. Age distribution of the analysed free-viewing data.
Histogram displaying the distribution of ages of included observers using a bin width of two.
Fig. 3
Fig. 3. Protracted development of semantic salience.
ad, The points display the mean proportion of dwell time and first fixations directed towards objects of four semantic features. The error bars indicate ±1 s.e.m. Please note that each age bin spans two years. Due to space constraints, only every second tick mark is labelled. A total of 6,720 participants were included in the analysis; for a more detailed distribution of participants across age groups, please refer to Fig. 2. Semantic categories are indicated by colours, as shown in the key. The lines show the corresponding best-fitting polynomials. In c and d, the horizontal lines above the plots indicate the level of evidence for a given bin to be part of a broad linear change via shades of grey, as shown in the key (sliding window analysis; see main text and Methods). Red shading marks age bins with lower sensitivity to developmental changes, which were disregarded for curve fitting (n < 90 per bin). Panels a and b show the trajectories for all features in a single plot for comparisons of scale; c and d zoom in on each semantic category to highlight developmental changes. e, The left image displays object pixel masks for an example image, with colours corresponding to the categories in ad (objects outside these categories shown in light grey). The middle and right images display alpha-blended fixation overlays for the same image, showing all fixations (middle) or only first fixations after image onset (right) for two age groups. Fixation overlays shown in blue and red correspond to ages 5–6 and 19–20, respectively. These age groups are marked with blue and red diamonds above the x axis in c. Panel e adapted from ref. under a Creative Commons license CC BY 4.0.
Fig. 4
Fig. 4. Protracted development of the horizontal bias.
a, Polar histograms for saccades across 36 direction bins for ages 5–6 to 13–14. Age is indicated by colour as shown in the key. b, The average proportion of horizontal fixations across age bins ± 1 s.e.m. (points and error bars, respectively). n = 6,720 participants were included in the analysis; for a more detailed distribution of participants across age groups, please refer to Fig. 2. Please note that each age bin spans two years. Due to space constraints, only every second tick mark is labelled. The black line shows the best-fitting polynomial. The horizontal lines at the top indicate the level of evidence for a given bin to be part of a broad linear change via shades of grey, as shown in the key (sliding window analysis; see main text and Methods). The red shading marks age bins with lower sensitivity for developmental changes, which were disregarded for curve fitting (n < 90 per bin).
Fig. 5
Fig. 5. Protracted development of visual exploration.
ac, The points indicate the mean distance of fixations to the image centroid (in pixels; a), the average number of objects fixated (b) and the average fixation frequency (Hz; c) for age bins ranging from ages 5–6 to 71–72 (x axes). In total, 6,720 participants were included in the analysis; for a more detailed distribution of participants across age groups, please refer to Fig. 2. Please note that each age bin spans two years. Due to space constraints, only every second tick mark is labelled. The error bars indicate ±1 s.e.m. The black lines show the best-fitting polynomials. The horizontal lines above each plot indicate the level of evidence for a given bin to be part of a broad linear change via shades of grey, as shown in the key (sliding window analysis; see main text and Methods). The red shading marks age bins with lower sensitivity to developmental changes, which were disregarded for curve fitting (n < 90 per bin).
Fig. 6
Fig. 6. Protracted development of inter-observer similarity.
a, The average entropy of group-level fixation maps across age bins. b, Fixation data from observers aged 5–22 overlaid as coloured circles on one example image. The colours correspond to age groups as indicated by the colour bar. Note the lower dispersion of hotter colours, indicating less dispersion at the group level for adult participants. c, The average entropy of observer-specific fixation maps across age bins. d, The mean observer similarity for each age bin, as indicated by the average pairwise correlation of observer-specific dwell time distributions across objects. A total of 6,720 participants were included in the analysis; for a more detailed distribution of participants across age groups, please refer to Fig. 2. Note that for a, c and d, each age bin spans two years. Due to space constraints, only every second tick mark is labelled. The red shading marks age bins with lower sensitivity to developmental changes, which were disregarded for curve fitting (n < 90 per bin). All error bars indicate ±1 s.e.m., and the lines indicate the best-fitting polynomial. The lines above each plot indicate the level of evidence for a given bin to be part of a broad linear change via shades of grey, as shown in the key (sliding window analysis; see main text and Methods). Panel b adapted from ref. under a Creative Commons license CC BY 4.0.

References

    1. Itti, L., Koch, C., Itti, L. & Koch, C. A saliency-based mechanism for overt and covert shifts of visual attention. Vis. Res.40, 1489–1506 (2000). - PubMed
    1. Harel, J., Koch, C. & Perona, P. Graph-based visual saliency. In Proc. Neural Information Processing Systems 19https://papers.nips.cc/paper_files/paper/2006/file/4db0f8b0fc895da263fd7... (NeurIPS, 2006).
    1. Stoll, J., Thrun, M., Nuthmann, A. & Einhäuser, W. Overt attention in natural scenes: objects dominate features. Vis. Res.107, 36–48 (2015). - PubMed
    1. Henderson, J. M. & Hayes, T. R. Meaning-based guidance of attention in scenes as revealed by meaning maps. Nat. Hum. Behav.1, 743–747 (2017). - PMC - PubMed
    1. Xu, J., Jiang, M., Wang, S., Kankanhalli, M. & Zhao, Q. Predicting human gaze beyond pixels. J. Vis.14, 28 (2014). - PubMed