. 2025 Aug;32(8):1488-1502.
doi: 10.1038/s41594-025-01565-x. Epub 2025 Jun 5.

Comprehensive analysis of Saccharomyces cerevisiae intron structures in vivo

Affiliations

Comprehensive analysis of Saccharomyces cerevisiae intron structures in vivo

Ramya Rangan et al. Nat Struct Mol Biol. 2025 Aug.

Abstract

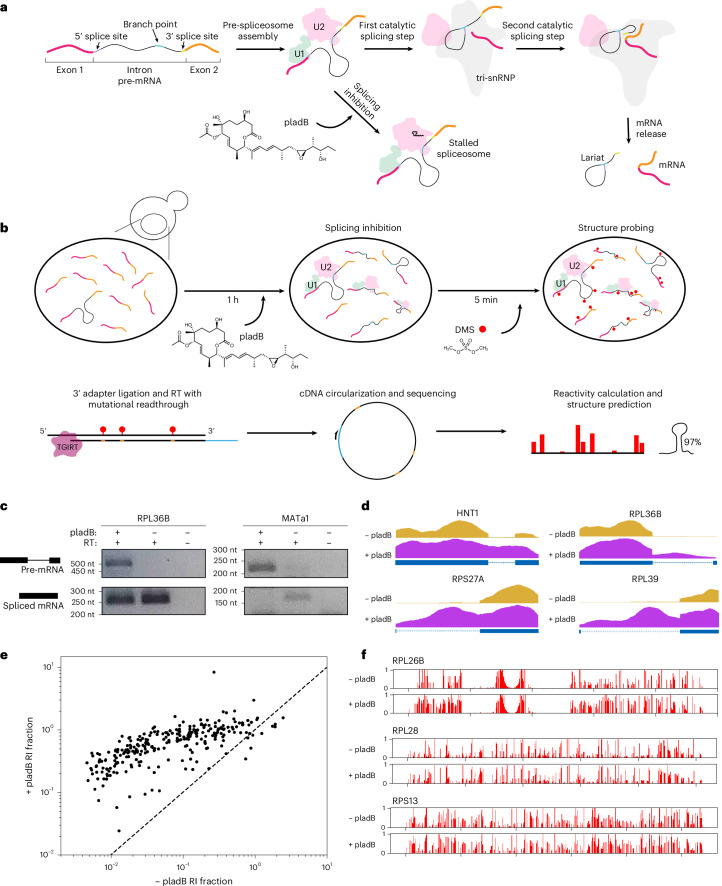
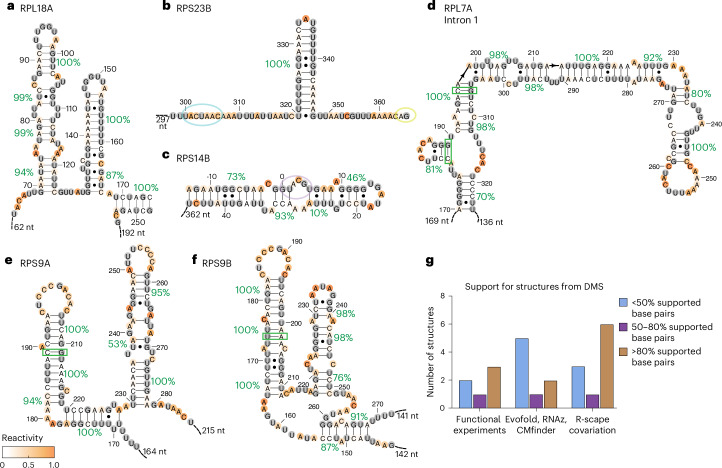
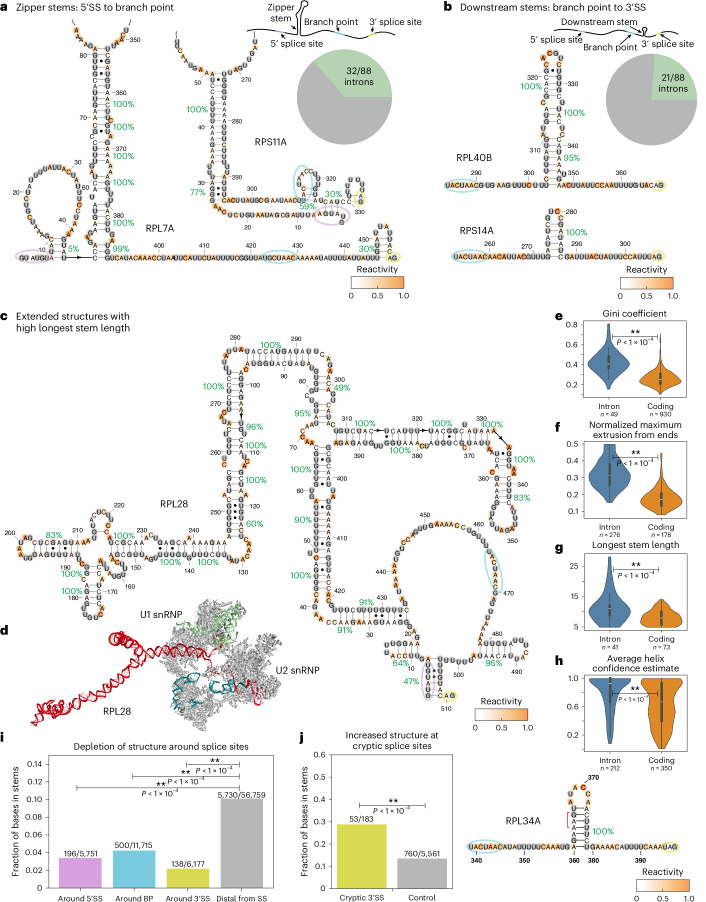
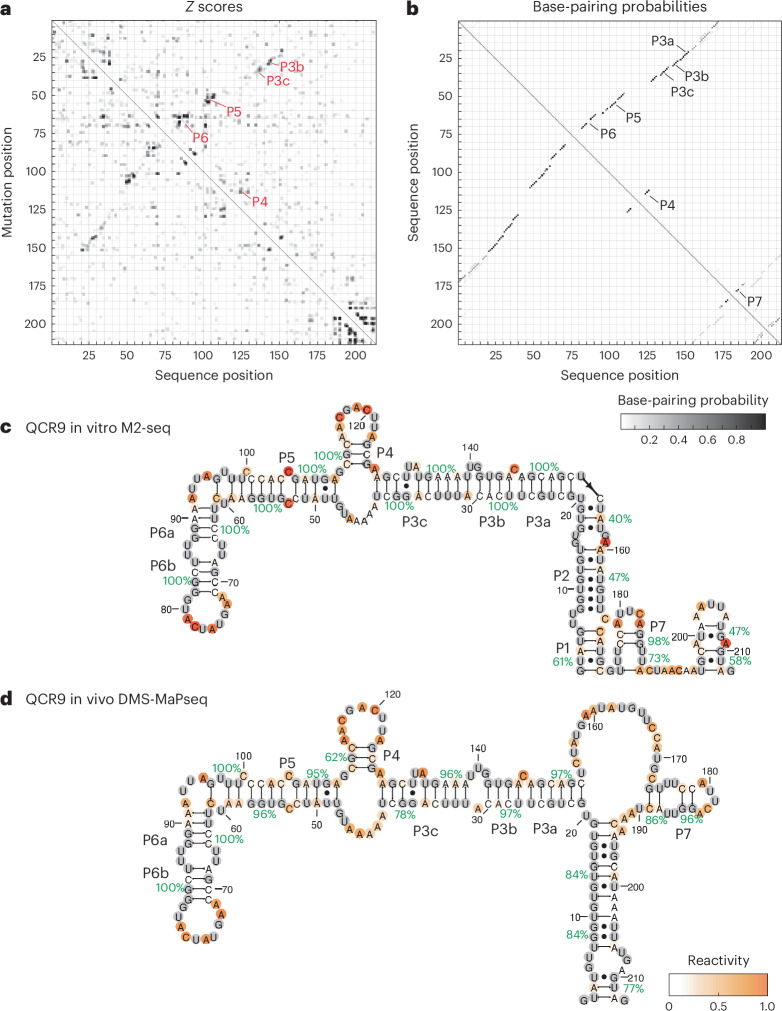
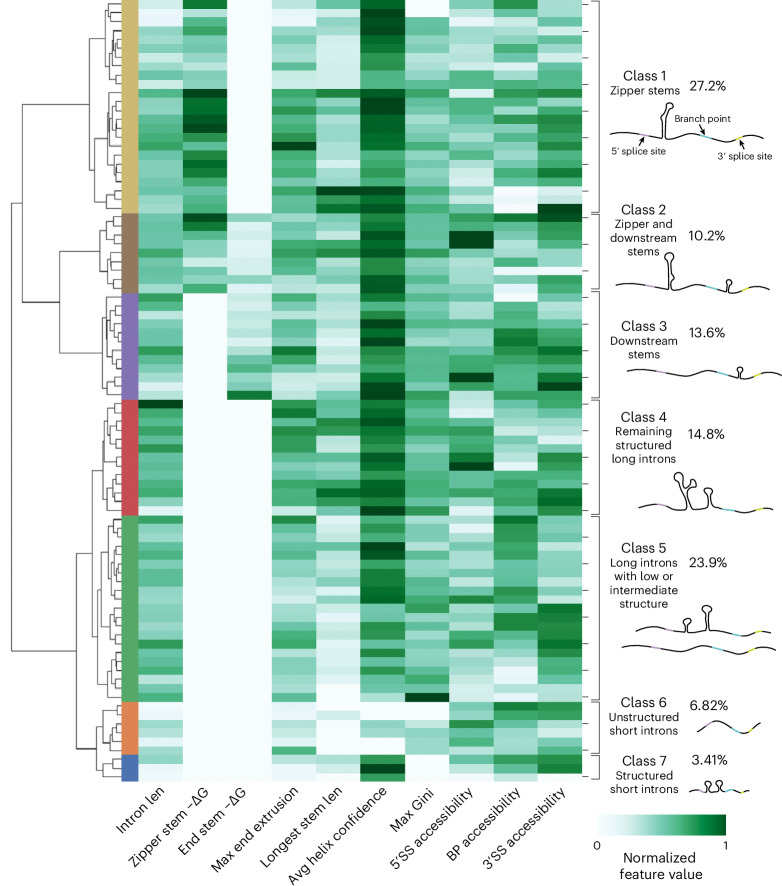
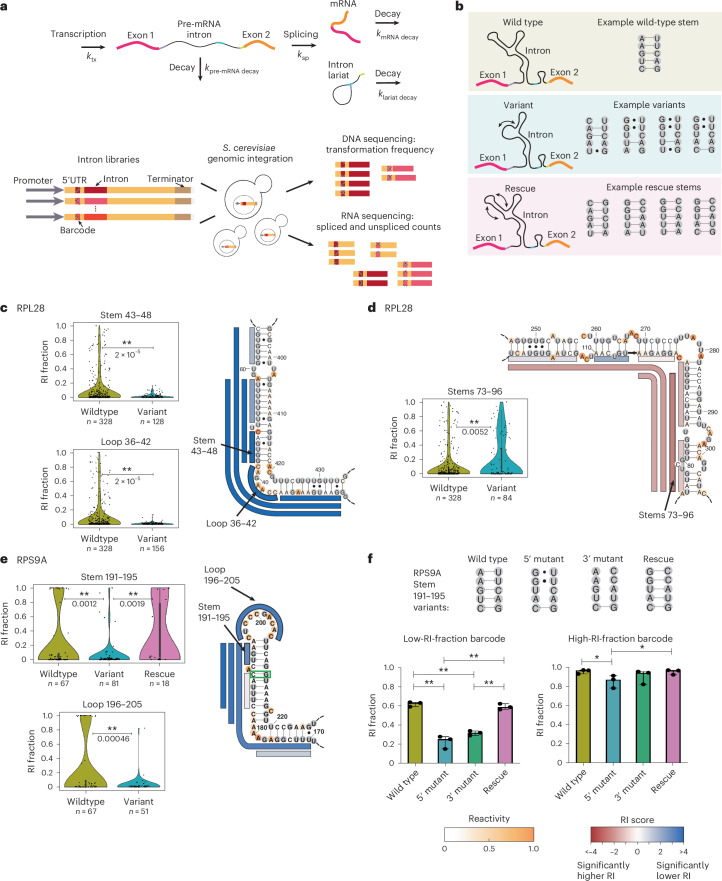
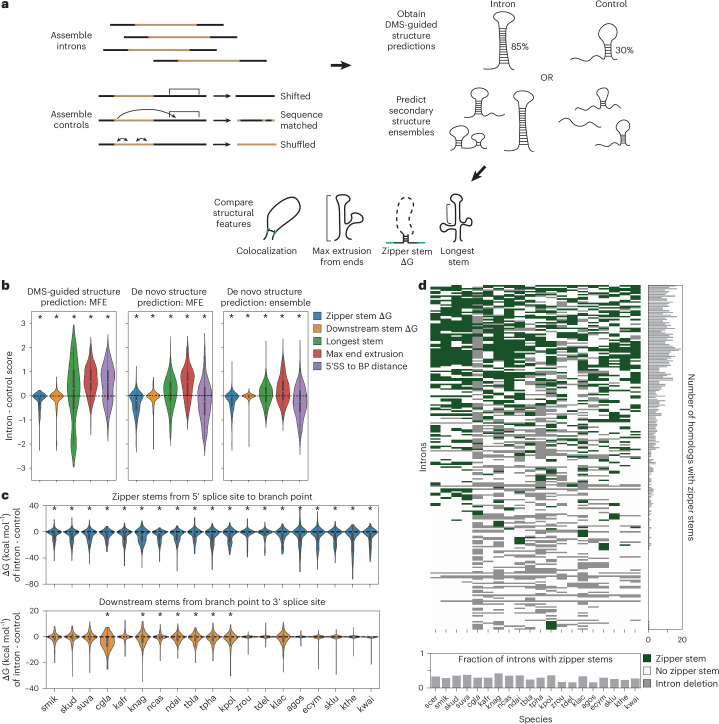
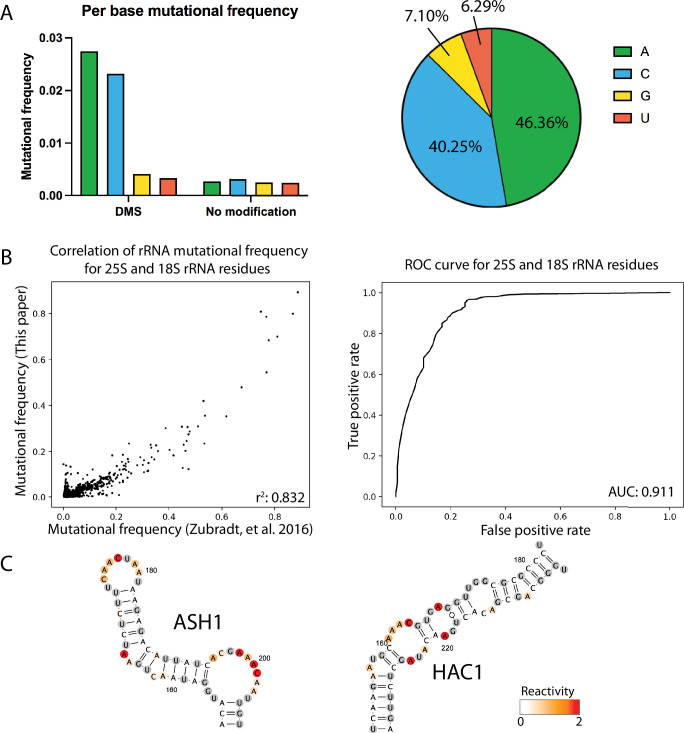
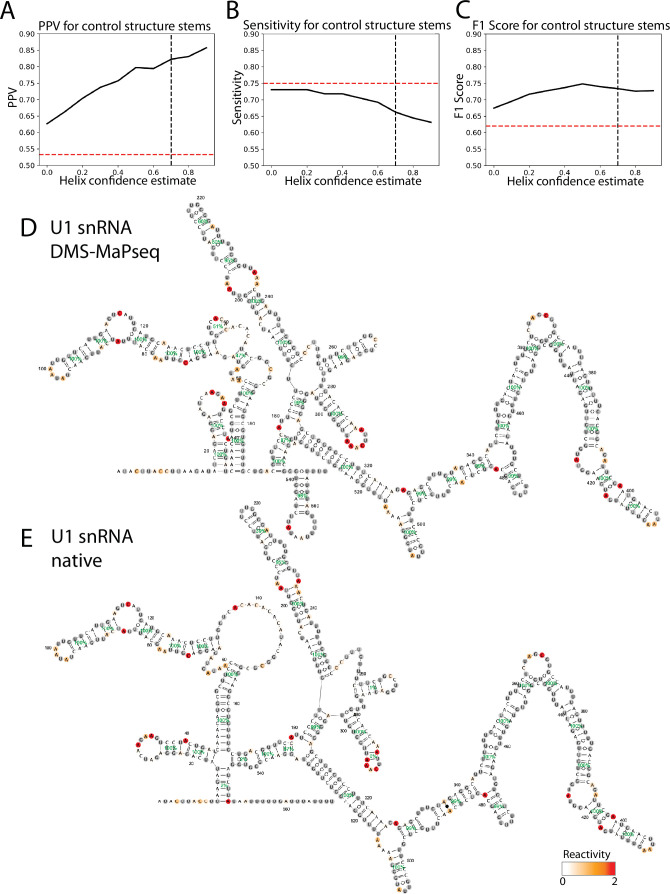
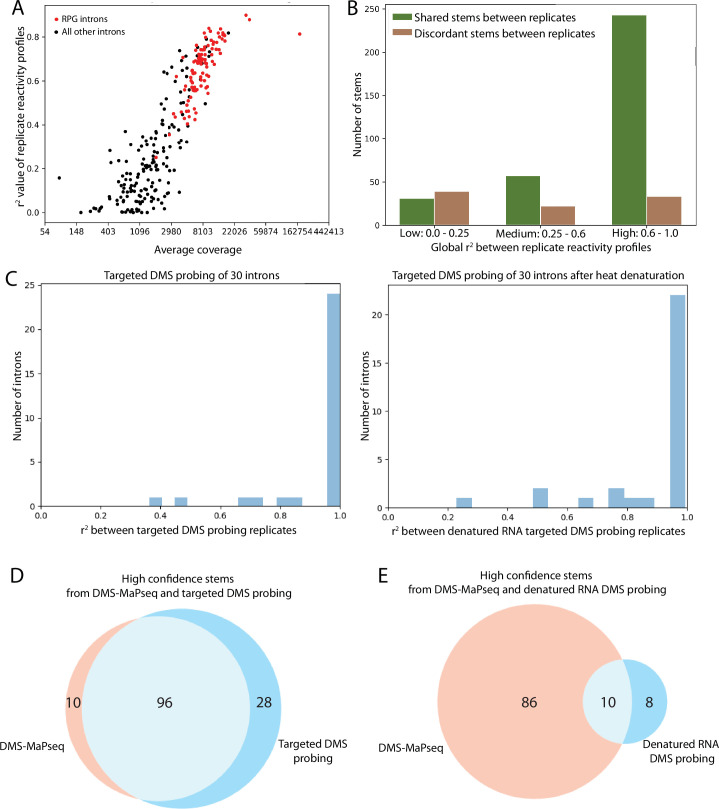
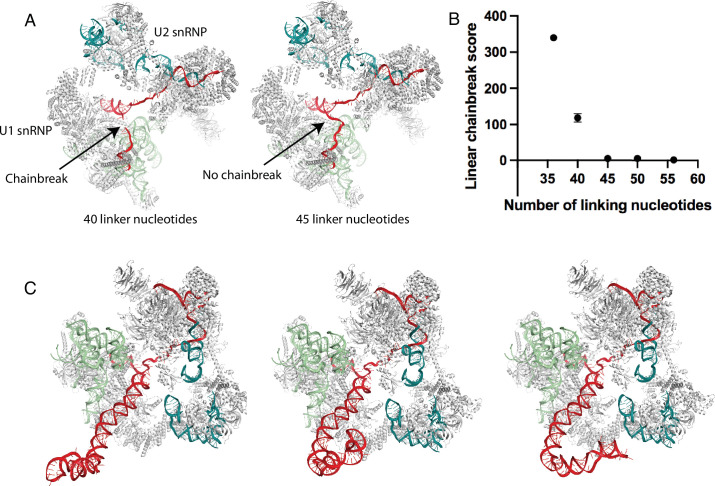
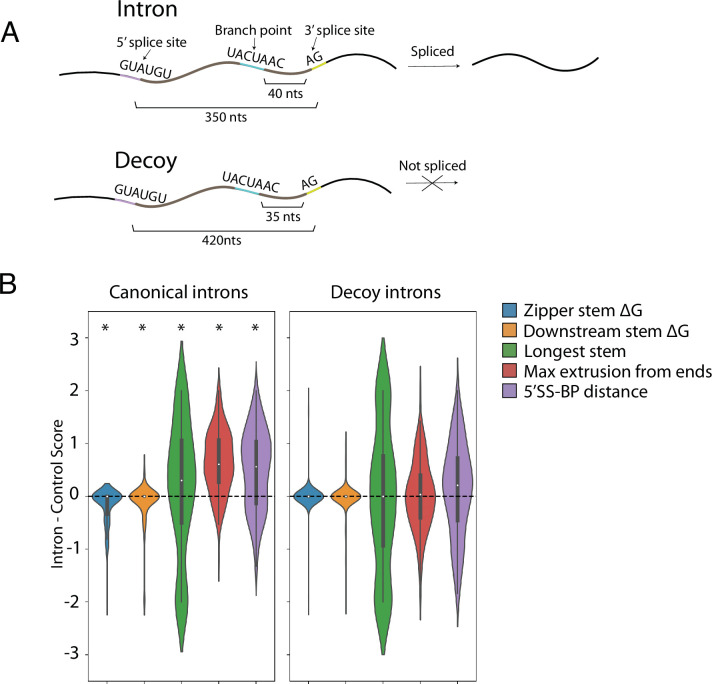
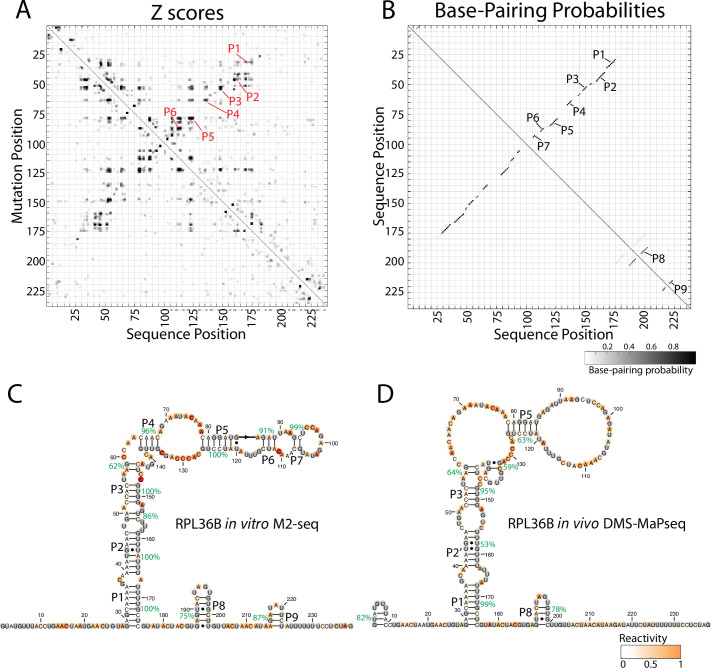
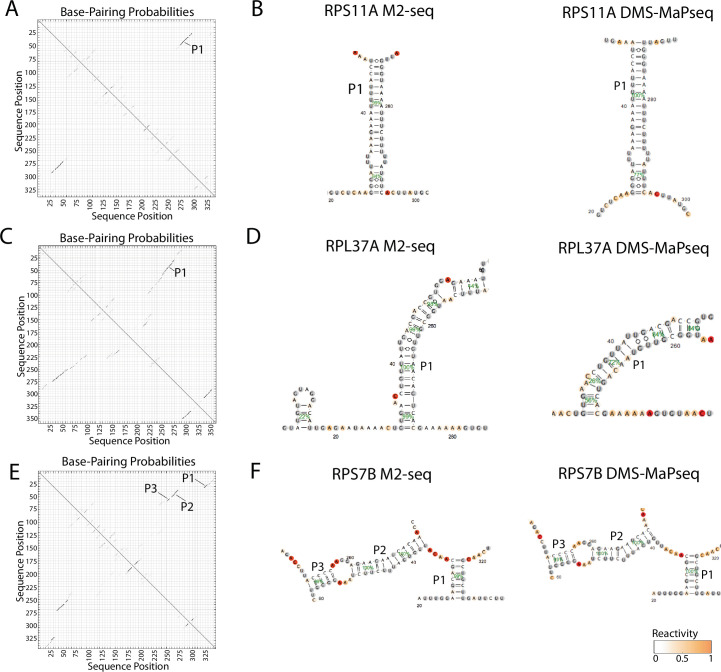
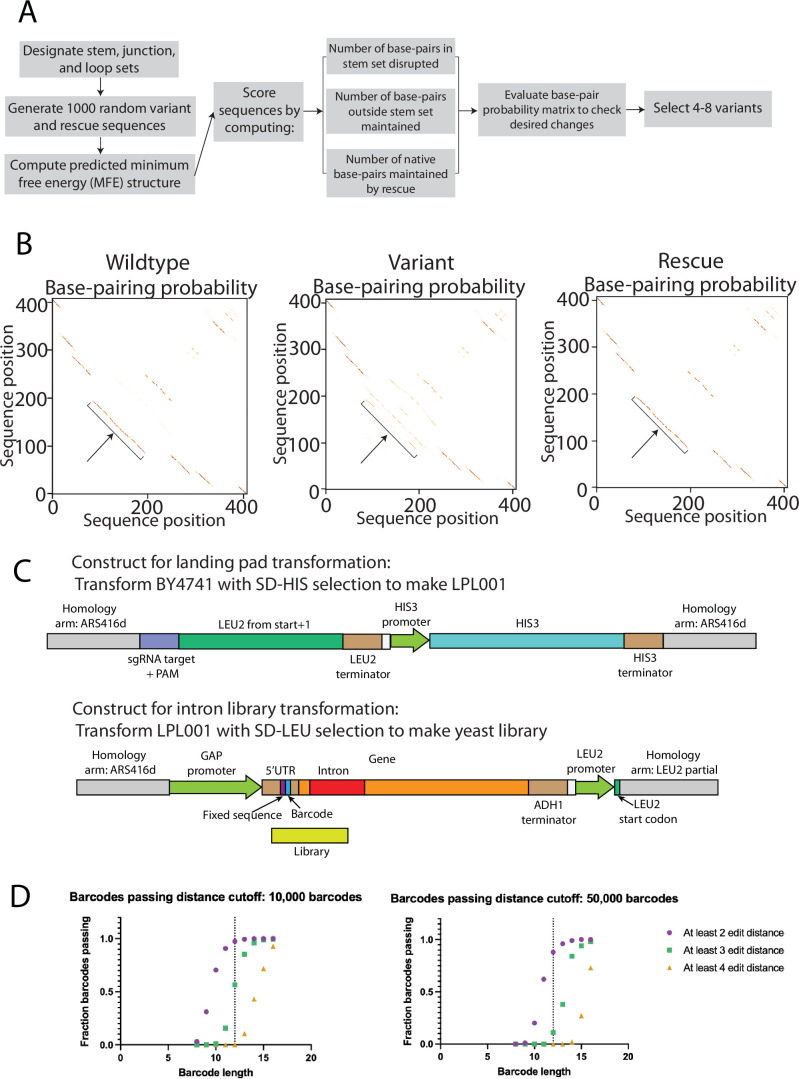
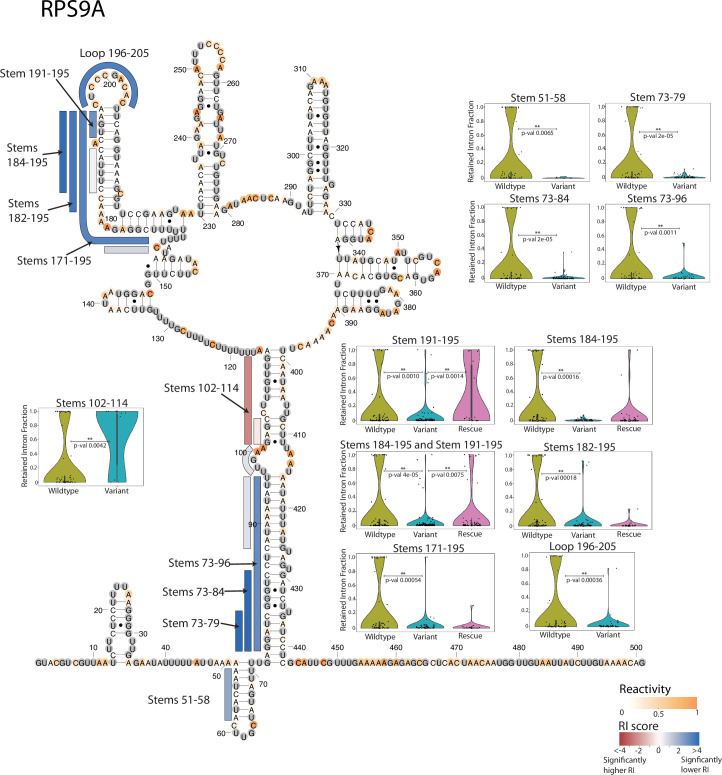
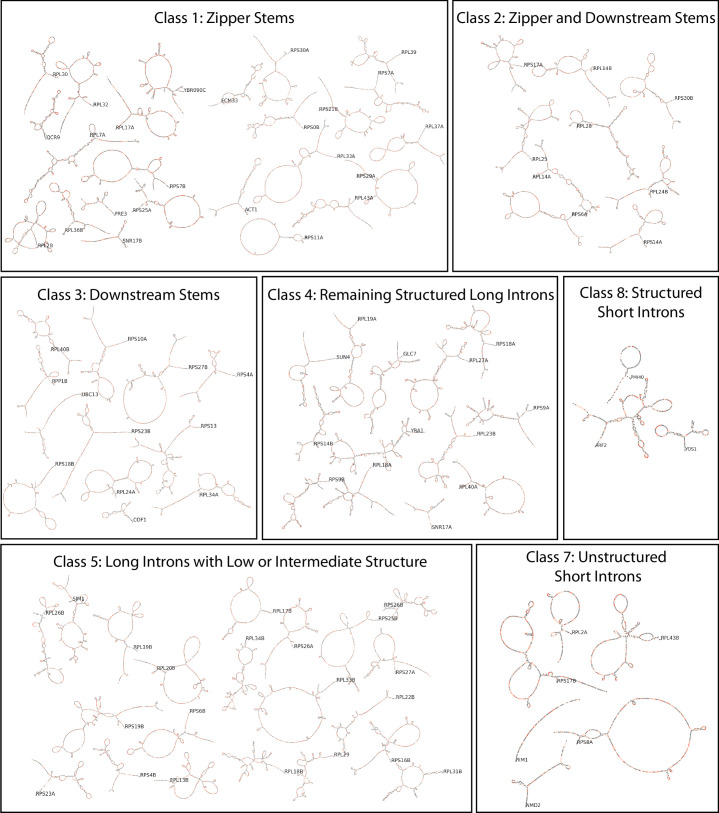
Pre-mRNA secondary structures are hypothesized to regulate RNA processing pathways, but such structures have been difficult to visualize in vivo. Here, we characterize Saccharomyces cerevisiae pre-mRNA structures through transcriptome-wide dimethyl sulfate probing, enriching for low-abundance pre-mRNA through splicing inhibition. We cross-validate structures found from phylogenetic and mutational studies and identify structures within the majority of measured introns (79 of 88). We find widespread formation of 'zipper stems' between the 5' splice site and branch point, 'downstream stems' between the branch point and the 3' splice site, and previously uncharacterized long stems that distinguish pre-mRNA from spliced mRNA. Multi-dimensional chemical mapping reveals intron structures that independently form in vitro without the presence of binding partners, and structure ensemble prediction suggests that such structures appear in introns across the Saccharomyces genus. We further develop a high-throughput functional assay to characterize variants of RNA structure (VARS-seq), applying it to 135 sets of stems across 7 introns, identifying structured elements that alter retained intron levels at a distance from canonical splice sites. This transcriptome-wide inference of intron RNA structures introduces alternative paradigms and model systems for understanding how pre-mRNA folding influences gene expression.


Conflict of interest statement

Competing interests: The authors declare no competing interests.

Figures

Fig. 1
Fig. 1. Splicing inhibition by pladB allows for accumulation of pre-mRNA.
a, Schematic of RNA splicing. b, Schematic of splicing inhibition, followed by the DMS-MaPseq experiment. c, Accumulation of pre-mRNA for RPL36B and MATa1, assessed using RT–PCR. This experiment was repeated with a biological replicate, with similar results. d, Read coverage across intron-containing pre-mRNA with (purple) and without (orange) pladB treatment. e, The RI fraction with and without pladB treatment. Points are plotted on a log scale, and the equal retained fraction from both conditions is indicated by the dashed line. RI, retained intron. f, Comparison of reactivity values for three introns with and without pladB treatment. Source data
Fig. 2
Fig. 2. Support from DMS reactivity for in vivo formation of control structures and proposed functional structures.
af, Helix confidence estimates and covariation for intron structures reported in RPL18A (a), RPS23B (b), RPS14B (c), the first intron in RPL7A (d), RPS9A (e) and RPS9B (f). Secondary structures are colored according to DMS reactivity, and helix confidence estimates are depicted as green percentages. The 5′ splice site, branch point and 3′ splice site sequences are circled in purple, blue and yellow, respectively. Covarying base pairs in RPS9A, RPS9B and RPL7A are marked with green boxes. g, Summary of the percentage of supported base pairs in structures proposed in prior functional studies, R-scape scans for covariation in multiple sequence alignments (MSAs), and other approaches using sequence alignments to pinpoint structures (Evofold, RNAz and cMfinder). A base pair is supported if it is included in a stem whose helix confidence estimate is >70%, and base-pair support statistics are computed on the basis of all base pairs in proposed structures (functional experiments, Evofold, RNAz, cMfinder) or significantly covarying base pairs (R-scape covariation). Source data
Fig. 3
Fig. 3. Structural insights from DMS probing of S. cerevisiae introns.
a, Reactivity support for zipper stems in RPL7A and RPS11A, and a pie chart representing the fraction of introns with zipper stems. 5′SS, 5′ splice site. b, Reactivity support for downstream stems connecting the branch point and 3′ splice site in RPL40B and RPS14A, and a pie chart representing the fraction of introns with downstream stems. 3′SS, 3′ splice site. c,The secondary structure of the intron in RPL28, predicted by RNAstructure guided by DMS reactivity. d, The top-scoring 3D model for the RPL28 intron in the context of the A complex spliceosome (PDB ID: 6G90), modeled using the secondary structure derived from DMS-MaPseq. eh, Comparisons between introns and coding regions for the following secondary structure features: the Gini coefficient (e), normalized maximum extrusion from ends (f), longest stem length (g) and average helix confidence estimate (h). P values were computed using one-sided Wilcoxon ranked-sum tests to compare classes. In box plots, the median is the center white point, box limits are the 25th (Q1) and 75th (Q3) percentiles, and whiskers extend to the smallest and largest values that fall within 1.5 times the interquartile range below Q1 and above Q3. i, Proportion of nucleotides in high-confidence stems from sequence intervals surrounding the canonical 5′ splice site, branch point and 3′ splice site sequences. Intron sequence positions external to these intervals were marked as ‘distal from SS.’ j, Comparison of the protection by high-confidence stems between nucleotides in cryptic splice sites versus surrounding nucleotides. An example from RPL34A is shown with a stem occluding a cryptic 3′ splice site (red bracket). Secondary structures are colored by DMS reactivity and are annotated with helix confidence estimates. The 5′ splice site, branch point and 3′ splice site sequences are circled in purple, blue and yellow, respectively. In ij, P values were computed with Chi-squared tests on 2 × 2 contingency tables. Source data
Fig. 4
Fig. 4. Comparing in vivo and in vitro folding of intron RNA structures.
a, In vitro M2-seq Z scores for the intron in QCR9, with peaks representing helices annotated in red. b, In vitro chemical reactivity base-pairing probabilities for the QCR9 intron using one- and two-dimensional (1D and 2D) chemical reactivity from M2-seq, with peaks representing helices annotated in black. c,d, Secondary structure predictions guided by 1D and 2D DMS probing data for the intron in QCR9 from in vitro M2-seq (c) and in vivo DMS-MaPseq (d).
Fig. 5
Fig. 5. Structural landscape for S. cerevisiae introns.
Heatmap and dendrogram summarizing intron structural classes, with hierarchical clustering based on secondary structure features. In addition to the features displayed on the heatmap, flags indicating whether zipper stems and downstream stems were present were included as features for hierarchical clustering. ΔG, folding free energy; len, length; SS, splice site; BP, branch point. Source data
Fig. 6
Fig. 6. High-throughput structure–function assay for evaluating intron stem variants.
a, An overview of the structure-function experiment. ktx, transcription rate; kpre-mRNA, pre-mRNA decay rate; ksp, splicing rate; kmRNA decay, mRNA decay rate; klariat decay, intron lariat decay rate. b, Schematic for an example library design for one intron stem, with variants disrupting the stem and rescue sequences restoring base pairing. ce, The effects of structure variants on the RI fraction for two regions of the RPL28 intron (c,d) and for intron stems in RPS9A (e). For a given stem set or loop, violin plots depict data for the wild-type sequence and all variant sequences; unique barcodes are shown as black points. Data for rescue sequences are shown when included in the intron library. P values are indicated for comparisons between the wild-type and variant sequence sets, and between the variant and rescue sequence sets. P values were computed using two-sided permutation tests for the difference in mean statistic. In box plots, the median is the center white point, box limits are the 25th (Q1) and 75th (Q3) percentiles and whiskers extend to the smallest and largest values that fall within 1.5 times the interquartile range below Q1 and above Q3. Secondary structures are colored according to reactivity data. Bars alongside the secondary structure indicate the stem and loop disruption sets, with each bar representing a set of variant sequences mutating nucleotides across the full extent of the bar. These bars are colored by the RI score for the corresponding stem or loop disruption set. The RI score is computed as the negative log (P value) when comparing RI values between wild-type and variant sequences; the sign is used to indicate the effect direction, with positive values (shown as blue) for a lower variant RI fraction compared with the wild type, and negative values (shown as red) for a higher variant RI fraction compared with the wild type. Green boxes in e indicate significantly covarying residues. f, RI fractions as measured by RT–qPCR for individual strains containing a set of wild-type, variant and rescue sequences for RPS9A stem 191–195 (top), with data shown for strains constructed with two different barcode sequences from three biological replicates (bottom). Data are presented as median values with 95% confidence intervals. P values are computed with two-way ANOVA tests with multiple comparisons. Exact P values for the low-RI-fraction barcode case are as follows: wild type versus 5′ mutant P < 1 × 10⁻⁴, wild type versus 3′ mutant P < 1 × 10⁻⁴, 5′ mutant versus rescue P < 1 × 10⁻⁴ and 3′ mutant versus rescue P = 0.0003. Exact P values for the high-RI-fraction barcode case are as follows: wild type versus 5′ mutant P = 0.018 and 5′ mutant versus rescue P = 0.021. Source data
Fig. 7
Fig. 7. De novo secondary structure feature prediction for S. cerevisiae and the Saccharomyces genus.
a, Workflow for comparisons between introns’ secondary structure ensembles and those of control sequences. b, Comparison of secondary structure feature enrichment between introns and control sequences for DMS-guided structure prediction (left; with folding engine RNAstructure, comparing introns to shifted genomic controls), de novo MFE structure prediction (middle; with folding engine RNAstructure, comparing introns with shifted genomic controls), and de novo ensemble structure prediction (right; with folding engine Vienna 2.0, comparing introns with shuffled sequence controls). *P < 0.01 by two-sided Wilcoxon ranked-sum test. Exact P values from left to right are as follows for the left panel: P < 1 × 10⁻⁴, P = 0.0003, P = 0.0007, P < 1 × 10⁻⁴, P < 1 × 10⁻⁴; for the middle panel: P < 1 × 10⁻⁴, P = 0.0072, P = 0.0008, P < 1 × 10⁻⁴, P = 0.0015; and for the right panel: P < 1 × 10⁻⁴, P = 0.0003, P = 0.0011, P < 1 × 10⁻⁴, P < 1 × 10⁻⁴. In the left and middle panels, 140 introns are compared; 288 introns are compared in the right panel. MFE, minimum free-energy; SS, splice site; BP, branch point; intron - control score, difference between intron and control score. c, Differences in zipper stem (top) and downstream stem (bottom) ΔG between introns and shuffled sequence controls for introns in the Saccharomyces genus, using Vienna 2.0 ensemble predictions. *P < 0.01 by two-sided Wilcoxon ranked-sum test. All P values for the zipper stem comparisons are <1 × 10⁻⁴. For each species, the number of introns compared for both stem types and the P value for the downstream stem comparison are as follows: smik (n = 279, P = 0.00150), skud (n = 279, P = 0.21), suva (n = 278, P = 0.07), cgla (n = 100, P < 1 × 10⁻⁴), kafr (n = 216, P = 0.83), knag (n = 175, P = 0.011), ncas (n = 250, P = 0.10), ndai (n = 218, P = 0.00056), tbla (n = 163, P = 0.0017), tpha (n = 143, P = 0.0005), kpol (n = 175, P < 1 × 10⁻⁴), zrou (n = 166, P = 0.28), tdel (n = 202, P = 0.58), klac (n = 151, P = 0.0026), agos (n = 185, P = 0.26), ecym (n = 19, P = 0.41), sklu (n = 229, P = 0.27), kthe (n = 215, P = 0.31) and kwal (n = 210, P = 0.011). d, Distribution of zipper stems across introns in the Saccharomyces genus. Green values on the heatmap indicate a predicted zipper stem; white indicates no predicted zipper stem; gray values indicate deleted introns. Ohnologous introns are combined into a single row, and a zipper stem is annotated if present in either homolog. The species represented in this figure are: Eremothecium gossypii (agos), Candida glabrata (cgla), Eremothecium cymbalariae (ecym), Kazachstania africana (kafr), Kluyveromyces lactis (klac), Kazachstania naganishii (knag), Vanderwaltozyma polyspora (kpol), Lachancea thermotolerans (kthe), Lachancea waltii (kwal), Naumovozyma castellii (ncas), Naumovozyma dairenensis (ndai), Saccharomyces kudiavzevii (skud), Saccharomyces mikatae (smik), Saccharomyces uvarum (suva), Tetrapisispora blattae (tbla), Torulaspora delbrueckii (tdel), Torulaspora phaffii (tpha) and Zygosaccharomyces rouxii (zrou). In box plots, the median is the center white point, box limits are the 25th (Q1) and 75th (Q3) percentiles, and whiskers extend to the smallest and largest values that fall within 1.5 times the interquartile range below Q1 and above Q3. Source data
Extended Data Fig. 1
Extended Data Fig. 1. DMS-MaPseq data quality.
A) Per-base mutational frequencies. B) Accuracy of mutational frequency values for rRNA residues. C) HAC1 and ASH1 positive control structures with overlaid reactivity profiles. Source data
Extended Data Fig. 2
Extended Data Fig. 2. Support from DMS reactivity for in vivo formation of control structures.
A) PPV, B) sensitivity, and C) F1 score for structure prediction of a set of control RNA structures (rRNAs, tRNAs, snRNAs, and mRNAs; Supplementary Table 2), using RNAstructure guided by DMS with varying helix confidence estimate cutoffs for calling stems. The black dotted line represents the helix confidence estimate 0.7 chosen in this paper. The red dotted line represents the PPV, sensitivity, and F1 score for Vienna RNA structure prediction without using DMS data. D)-E) DMS-MaPseq structure prediction for the U1 snRNA compared to the native secondary structure. D) DMS-guided secondary structure prediction for the U1 snRNA, with reactivity values overlaid and helix confidence estimates indicated in green percentages. E) Native secondary structure for the U1 snRNA, with DMS reactivity overlaid along with helix confidence estimates. For the native structure, helix confidence estimates were computed as the percent of bootstrapping iterations where the helix was recovered when sampling DMS reactivity values and making structure predictions. Source data
Extended Data Fig. 3
Extended Data Fig. 3. DMS-MaPseq and targeted DMS probing reproducibility between replicates.
A) r2 between replicates for each intron in S. cerevisiae versus the average sequencing coverage between replicates. B) Bar graph comparing the number of high confidence stems that are shared vs discordant between replicates for introns in different ranges of replicate correlation. C) r2 between replicates of targeted DMS probing for 30 introns without (left) or with (right) heat denaturation. D) The number of high confidence stems found in 24 introns with r2 > 0.9 from targeted DMS probing and r2 > 0.6 from DMS-MaPseq. E) The number of high confidence stems found in 22 introns with r2 > 0.9 from targeted DMS probing of denatured RNA and r2 > 0.6 from DMS-MaPseq. Source data
Extended Data Fig. 4
Extended Data Fig. 4. Structural modeling with the A state spliceosome.
A) Sample Rosetta models of introns with varying linker lengths to identify linker lengths for zipper stems compatible with the A state spliceosome structure. B) Penalty for chain breaks as modeled linker length increases. Data are presented as mean values +/- standard deviation. C) Top 3 models for RPL36B intron in the context of the A state spliceosome, with the RPL36B intron secondary structure specified from DMS-MaPseq. Source data
Extended Data Fig. 5
Extended Data Fig. 5. Secondary structure features for introns and non-splicing decoy sequences.
A) Intron and decoy sequence schematic. Nucleotide lengths depicted are representative lengths for introns and decoy sequences, with decoy sequences chosen to have 5’ splice site, branch point, and 3’ splice site placements matching length distributions from canonical introns (see Methods). B) Secondary structure features are enriched in standard canonical spliced introns in yeast, but not in decoy sequences (genomic intervals which match splice site sequences and yet do not splice). *p-value < 0.01 by two-sided Wilcoxon ranked-sum test. Left: N = 140 canonical introns were compared to controls, yielding p-values (left to right): <1E-4, 0.00027, 0.00072, <1E-4, <1E-4. Right: N = 167 decoy introns were compared to controls, yielding p-values (left to right): 0.74, 0.23, 0.68, 0.37, 0.10. Embedded box plots mark the median as the center white point and include a box from the 25th (Q1) to 75th (Q3) percentile, extending whiskers to the smallest and largest value that fall within 1.5 times the interquartile range below Q1 and above Q3. Source data
Extended Data Fig. 6
Extended Data Fig. 6. Multidimensional chemical mapping for RPL36B.
A) In vitro M2-seq Z scores for the intron in RPL36B, with peaks representing helices annotated in red. B) In vitro chemical reactivity base-pairing probabilities for RPL36B using 1D and 2D chemical reactivity from M2-seq. Secondary structure predictions guided by 1D and 2D DMS probing data for the intron in RPL36B C) from in vitro M2-seq, and D) from in vivo DMS-MaPseq.
Extended Data Fig. 7
Extended Data Fig. 7. Base-pairing probabilities and secondary structure predictions from in vitro M2-seq and in vivo DMS-MaPseq.
Base-pairing probabilities and secondary structure predictions are shown for introns in RPS11A (A, B), RPL37A (C, D), RPS7B (E, F). (B, D, F) Secondary structures are guided by 1D and 2D DMS probing data from M2-seq (left) or by 1D DMS probing data from in vivo DMS-MaPseq (right).
Extended Data Fig. 8
Extended Data Fig. 8. Structure variant library design to measure spliced and unspliced RNA levels for intron variants.
A) Computational pipeline for designing variant and rescue sequences to assess stem and loop sets in an intron. B) Sample base-pair probability matrix comparison between a set of wildtype (left), variant (middle), and rescue (right) sequences. The stem set targeted by this variant and rescue sequence are bracketed. C) Constructs used for constructing the landing pad strain LPL001 (top) and for transforming the intron library via genomic integration into LPL001 (bottom). D) Based on simulations sampling 10,000 or 50,000 random barcodes, the number of barcodes within 2, 3, or 4 edit distance of another barcode. The vertical line indicates the chosen barcode length (12). Source data
Extended Data Fig. 9
Extended Data Fig. 9. Effects of structure variants on retained intron levels for RPS9A variants.
For a given stem set or loop, violin plots depict data for the wildtype sequence and all variant sequences, with points for each unique barcode. Data for rescue sequences are shown when included in the intron library. p-values (computed by two-sided permutation tests) are indicated for comparisons between wildtype and variant sequences, and between variant and rescue sequences. There are 67 wildtype sequences compared to variant sequences in each plot. The numbers of variant sequences are as follows: 12 for stem 51-58, 75 for stem 73-79, 11 for stems 73-84, 39 for stems 73-96, 10 for stems 102-114, 81 for stem 191-195, 44 for stems 184-195, 60 for stems 182-195, 74 for stems 171-195, and 51 for loop 196-205. The numbers of rescue sequences are as follows: 18 for stem 191-195, 46 for stems 184-195, 25 for stems 182-195, and 24 for stems 171-195. Embedded box plots mark the median as the center white point and include a box from the 25th (Q1) to 75th (Q3) percentile, extending whiskers to the smallest and largest value that fall within 1.5 times the interquartile range below Q1 and above Q3. Secondary structures are colored by reactivity data, and bars alongside the secondary structure indicate stem and loop disruption sets, with each bar representing variant sequences mutating nucleotides across the full extent of the bar. These bars are colored by the retained intron (RI) score for the interval. The RI score is the negative log(p-value) comparing RI values between wildtype and variant sequences, and the sign indicates the effect direction, with positive values (shown as blue) for lower variant RI compared to wildtype, and negative values (shown as red) for higher variant RI. Source data
Extended Data Fig. 10
Extended Data Fig. 10. One-page overview of secondary structures and overlaid DMS reactivity profiles for all introns with sufficient coverage from DMS-MaPseq.
Introns are grouped into classes from hierarchical clustering (Fig. 5). Secondary structures are depicted schematically using RiboGraphViz (https://github.com/DasLab/RiboGraphViz).

Similar articles

Cited by

References

    1. Wilkinson, M. E., Charenton, C. & Nagai, K. RNA splicing by the spliceosome. Annu. Rev. Biochem.89, 359–388 (2020). - PubMed
    1. Wang, Z. & Burge, C. B. Splicing regulation: from a parts list of regulatory elements to an integrated splicing code. RNA14, 802–813 (2008). - PMC - PubMed
    1. Petibon, C., Parenteau, J., Catala, M. & Elela, S. A. Introns regulate the production of ribosomal proteins by modulating splicing of duplicated ribosomal protein genes. Nucleic Acids Res.44, 3878–3891 (2016). - PMC - PubMed
    1. Lukacisin, M., Espinosa-Cantu, A. & Bollenbach, T. Intron-mediated induction of phenotypic heterogeneity. Nature605, 113–118 (2022). - PMC - PubMed
    1. Morgan, J. T., Fink, G. R. & Bartel, D. P. Excised linear introns regulate growth in yeast. Nature565, 606–611 (2019). - PMC - PubMed

LinkOut - more resources