. 2025 Jul;17(7):1756-1793.
doi: 10.1038/s44321-025-00255-x. Epub 2025 Jun 5.

Combined dendritic cell and anti-TIGIT immunotherapy potentiates adaptive NK cells against HIV-1

Affiliations

Combined dendritic cell and anti-TIGIT immunotherapy potentiates adaptive NK cells against HIV-1

Ildefonso Sánchez-Cerrillo et al. EMBO Mol Med. 2025 Jul.

Abstract

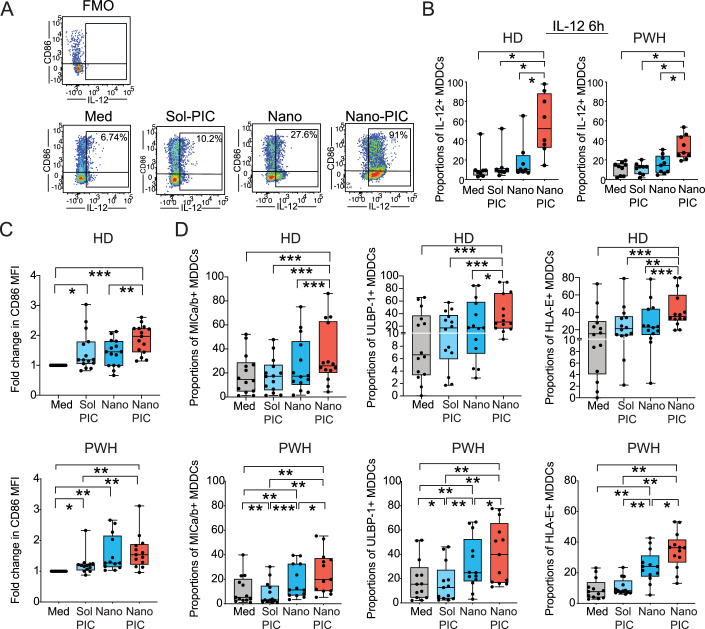
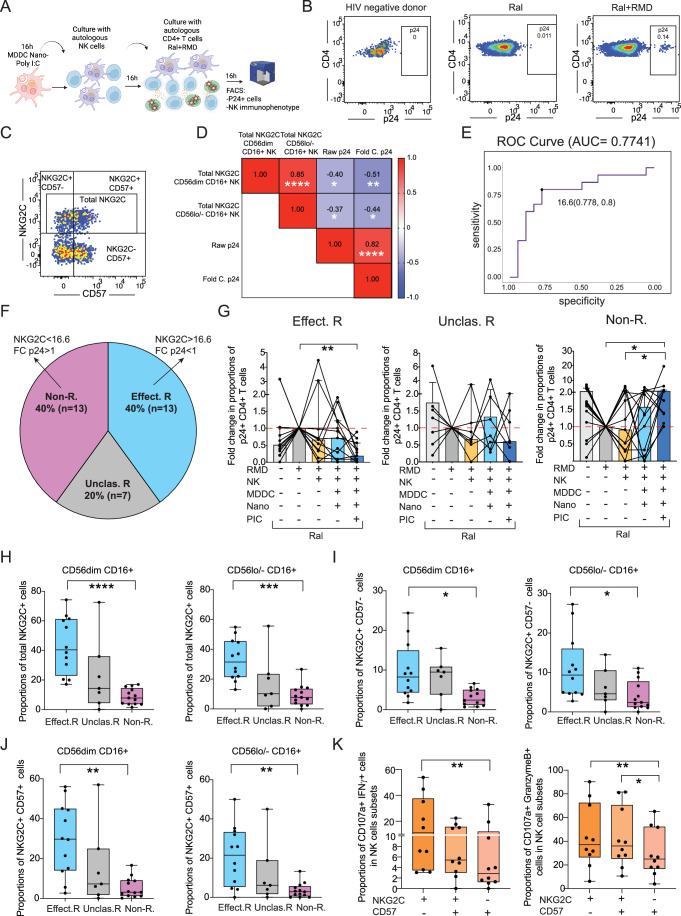
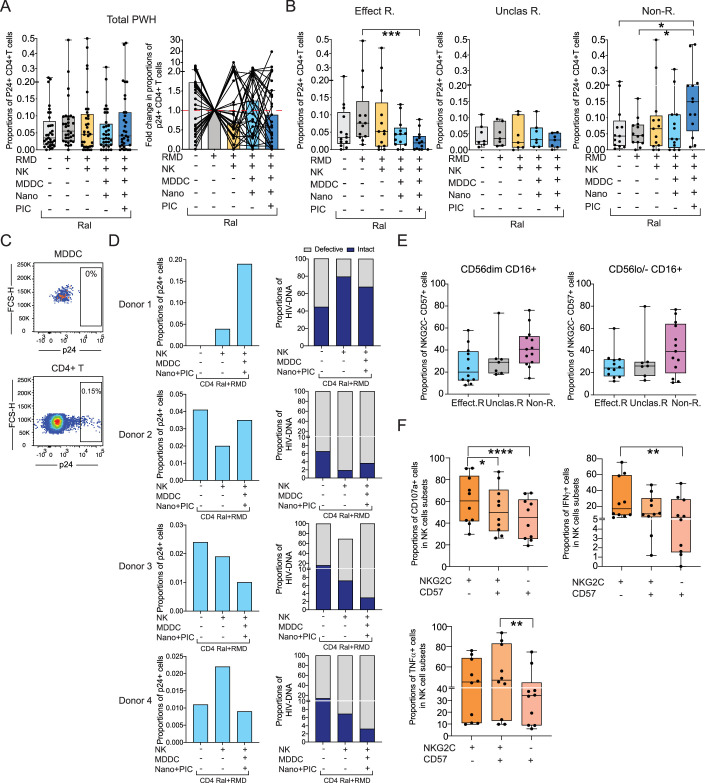
Natural Killer (NK) cells are promising candidates for targeting persistently infected CD4 + T cells in people with HIV-1 (PWH). However, chronicity of HIV-1 infection impairs NK cell functionality, requiring additional strategies to potentiate their cytotoxic activity. This study demonstrates that dendritic cells primed with nanoparticles containing Poly I:C (Nano-PIC-MDDC) enhance the natural cytotoxic function of NK cells from effective responder PWH. These NK cells exhibit increased proportions of NKG2C+ cell subsets capable of eliminating HIV-1 infected CD4 + T cells through the TRAIL receptor. In contrast, in non-responder PWH, elevated expression of the inhibitory receptor TIGIT is associated with reduced frequencies of NKG2C + NK cells and diminished TRAIL expression. TIGIT blockade restores cytotoxicity of NK cells from non-responder PWH against HIV-1-infected cells by upregulating TRAIL. Furthermore, combining Nano-PIC-MDDC-primed NK cells with anti-TIGIT immunotherapy in humanized NSG mice reduces the expansion of HIV-1 infected cells, preserves NKG2C + NK cell precursors and increases TRAIL expression in tissue. Collectively, these findings support the combined use of Nano-PIC-MDDC and TIGIT blockade as a promising immunotherapeutic strategy toward an HIV-1 cure.

Keywords: Dendritic Cell; HIV; Natural Killer; TIGIT; TRAIL.


Conflict of interest statement

Disclosure and competing interests statement. The authors declare no competing interests.

Figures

Figure 1
Figure 1. Analysis of cytokine production, maturation and expression of ligands for NK receptors in MDDC from HD and PWH stimulated with nanoparticle-encapsulated Poly I:C.
(A) Representative flow cytometry gating strategy defining expression of CD86 in combination with intracellular staining of IL-12 in MDDCs cultured in media (Med) or in the presence of soluble Poly I:C (Sol PIC) or empty (Nano) or poly:IC loaded nanoparticles (Nano PIC). FMO for IL-12 is shown. (B) Intracellular expression of IL-12 at 6 h in n = 8 HD (left panel) and n = 9 PWH (right panel). Data are represented in Box and Whiskers plots showing median values and maximum and minimum error bars. (C) Mean of fluorescence intensity (MFI) levels of CD86 in n = 15 from HD (upper plot) and from n = 13 (lower plot) PWH. Data are represented in Box and Whiskers plots showing median values and maximum and minimum error bars. (D) Proportions of NK receptor ligands MICa/b, ULBP-1 and HLA-E in n = 14 HD (upper plot) and n = 13 PWH (lower plot) donors cultured in these conditions. Data are represented in Box and Whiskers plots showing median values and maximum and minimum error bars. Statistical significance was calculated using a two-tailed Wilcoxon pair matched test and Bonferroni correction for multiple comparisons. *P < 0.05; **P < 0.01; ***P < 0.001. Source data are available online for this figure.
Figure 2
Figure 2. Nano-PIC-MDDCs promote the activation of cytotoxic NK cells from HD and PWH.
(A) Analysis of proportions of total CD107a+ (upper panels) and CD107a+ IFNγ+ cells (lower panels) on CD56dim CD16+ NK cells cultured in the absence or the presence of MDDC stimulated either with empty or PIC-loaded nanoparticles in n = 10 HD (left panel) and n = 10 PWH (right panel) donors. Data are represented in Box and Whiskers plots showing median values and maximum and minimum error bars. (B) Test of proportions of total CD107a+ CD56dim CD16 + NK cells with or without cell contact in a transwell assay in the same conditions using n = 7 HD (left panel) and n = 7 PWH (right panel) donors. Data are represented in Box and Whiskers plots showing median values and maximum and minimum error bars. (C) Analysis of NK-cell mediated natural cytotoxicity function assessed by proportions of dead target K562-GFP cell line after culture in the presence of NK cells in n = 11 HD and n = 8 PWH donors alone or co-cultured with MDDC treated with empty or PIC-loaded nanoparticles. Data are represented in Box and Whiskers plots showing median values and maximum and minimum error bars. Statistical significance was calculated using a Friedman test for multiple comparisons. *P < 0.05; **P < 0.01; ***P < 0.001; ****P < 0.0001. Source data are available online for this figure.
Figure 3
Figure 3. Impact of Nano-PIC-MDDC on cytotoxic function of NK cells from PWH against HIV-1 infected CD4 + T cells.
(A) Schematic representation experiment of functional assays evaluating the elimination p24 + CD4 + T cells after culture with NK cells primed by Nano-PIC-MDDC. (B) Representative flow cytometry dot plots showing intracellular expression of HIV-1 p24 on CD4 + T cells from a PWH in the presence of Raltegravir alone or in combination with Romidepsin. A staining background control from an HIV negative donor is also shown. (C) Representative flow cytometry dot plot representing NKG2C and CD57 expression in gated CD56dim CD16 + NK cells. (D) Heatmaps representing Spearman correlation matrix between memory NK subsets within CD56dim or CD56lo/- CD16 + NK cells and proportions of p24+ cells after co-culture with NK primed by Nano-PIC-MDDC immunotherapy. Fold changes in p24+ frequencies are also included. Levels of positive and negative associations are highlighted in different intensities of red and blue, respectively. Significant associations have also been highlighted. *P < 0.05; **P < 0.01; ****P < 0.0001. (E) ROC curve analysis, defining the cut-off based on NKG2C expression defining effective and non-responder PWH groups in our cohort. (F) Pie chart representing proportion of PWH from our cohort predicted as effective and non-responder PWH by ROC curve analysis and those PWH that were not classified by this model. (G) Fold change of intracellular expression of HIV-1 p24 on CD4 + T cells from aviremic ART PWH treated with Raltegravir and Romidepsin, in the absence or the presence of NK cells alone or stimulated with MDDCs treated with empty Nano or Nano-PIC. Data from three separate groups with effective-responders (Effect. R.; n = 13), unclassified (Unclas. R.; n = 7) and non-responders (Non-R.; n = 13) PWH to Nano-PIC-MDDC. (HJ) Proportions of total (H) NKG2C+ cells and different memory NK subsets based on combination of NKG2C and CD57 (I, J) on CD56dim or CD56lo/− CD16 + NK from effective responder (n = 13, Effect. R; blue), unclassified (n = 7, Unclas. R; gray) and non-responder (n = 13, Non-R.; pink) PWH after activation with Nano-PIC-MDDCs. Data are represented in Box and Whiskers plots showing median and maximum and minimum values. (K) Proportions of CD107a+ IFNγ+ (left) and CD107a+ Granzyme B+ (right) cells included in gated NK subsets defined by differential NKG2C and CD57 expression from (n = 10) selected effective responder PWH after PMA and Ionomycin stimulation (see methods). Data are represented in Box and Whiskers plots showing median and maximum and minimum values. Statistical significance was calculated using a Friedman or a Kruskal–Wallis tests for multiple comparisons. *P < 0.05; **P < 0.01; ***P < 0.001; ****P < 0.0001. Source data are available online for this figure.
Figure 4
Figure 4. Association of expression of TIGIT with memory NK cell subset proportions in response to Nano-PIC-MDDC and functional restoration after checkpoint receptor blockade.
(A) Fold change in proportions of TIGIT+ cells compared to basal in CD56dim (left) or CD56lo/− (right) CD16+ NK subsets after Nano-PIC-MDDC from effective responder (n = 10; Effect. R; blue), unclassified (n = 6; Unclas. R.; gray) and non-responder (n = 8; Non-R.; pink) responder PWH. Data are represented in Box and Whiskers plots showing median values and maximum and minimum error bars. (B) Spearman correlations between fold change proportions of TIGIT+ cells within CD56dim (left) or CD56lo/− (right) CD16+ NK and fold change proportions of p24+ CD4+ T cells after Nano-PIC-MDDC. (C) Spearman correlations between proportions of TIGIT+ cells and proportions of NKG2C+ CD57- memory NK subset (left) and NKG2C− CD57+ effector subset (right) after Nano-PIC-MDDC within CD56dim CD16+ NK. Data from effective responder, non-responders and unclassified PWH were highlighted in blue, pink and grey, respectively. P and R values in (B, C) considering all PWH or selected effective responder and non-responder groups are highlighted in black and grey, respectively. (D) Proportions of CD4 + T cells expressing HIV p24+ cells cultured alone or in combination with NK cultured with Nano-PIC-MDDC from n = 20 total PWH (left panel) and in n = 11 non responder individuals (right panel) in the presence of isotypic control mAb or individual treatment with anti-TIGIT. (E) Proportions of CD107a+ IFNγ + NK cells from non-responder PWH in the co-culture experimental conditions described in (D). Data are represented in Box and Whiskers plots showing median values and maximum and minimum error bars. Statistical significance was calculated using a Friedman or a Kruskal–Wallis tests for multiple comparisons or Spearman associations. Statistical P and R values considering all data (black) and without unclassified group (gray) are shown (B, C). *P < 0.05; **P < 0.01; ***P < 0.001. Source data are available online for this figure.
Figure 5
Figure 5. Analysis of expression of ligands for NK receptors on HIV-1-infected cells and mechanisms of cytotoxic function of NK cells primed with Nano-PIC-MDDC.
(A) Proportions of CD4+ T cells from PWH expressing the NK receptor ligands MICa/b (left), HLA-E (middle) and DR4 (right) within HIV-1 p24+ (purple) and p24- (yellow) populations in n = 7 PWH. Data are represented in Box and Whiskers plots showing median and maximum and minimum values in error bars. (B) Fold change proportions of TRAIL+ cells within adaptive NKG2C+ CD57− precursors (left) and mature NKG2C+ CD57+ (middle) and NKG2C- (right) NK subsets after Nano-PIC-MDDC from effective responder (n = 10; Effect. R; blue), unclassified responder (n = 6; Unclas. R; gray) and non-responder (n = 8; Non-R.; pink) PWH included in CD56dim CD16 + . Data are represented in Box and Whiskers plots showing median and maximum and minimum values in error bars. (C) Proportions of TRAIL+ cells within adaptive NKG2C + CD57+ and NKG2C+ CD57- cell subsets from effective responder (n = 10; Effect. R.; blue), unclassified responder (n = 6; Unclas. R; gray) and non-responder (n = 8; Non-R; pink) PWH included in CD56lo/- CD16 + NK subpopulation. Statistical significance was calculated using a two-tailed Wilcoxon matched pairs or a Mann–Whitney tests Statistical and Bonferroni correction was applied for multiple comparisons. Significance after removed outliers recognized by a Grubbs´test were highlighted in green. *P < 0.05; **P < 0.01. Data are represented in Box and Whiskers plots showing median and maximum and minimum values in error bars. (D) Spearman correlation between proportions of cells expressing TIGIT versus TRAIL in CD56dim CD16+ NK cells from PWH. Data from effective and non or unclassified responders PWH were highlighted in blue, pink and gray, respectively. Statistical P and R values considering all data (black), without unclassified group (gray) or removing outlier data recognized by a Grubb´s test (green) are shown. (E) Proportions of TRAIL in NKG2C+ CD57 + NK cells after Nano-PIC-MDDC from n = 8 PWH, in the presence of either IgG Isotypic control or anti-TIGIT antibodies. Statistical significance was calculated using a two-tailed Wilcoxon matched pairs test. (F) Ratio of TIGIT+ /TRAIL+ cells in NKG2C- CD57+ effector NK expressing from effective (n = 10; Effect. R; blue), unclassified (n = 6; Unclas.R; gray) and non (n = 8; Non-R.; pink) responders PWH in CD56dim (left) and CD56lo/− (right) CD16 + NK subsets. Statistical significance was calculated using a two-tailed Mann–Whitney test and Bonferroni correction for multiple comparisons. Data are represented in Box and Whiskers plots showing median and maximum and minimum values in error bars. (G) Fold change of p24+ CD4+ T cells from n = 13 PWH previously identified as effective responders treated with Raltegravir and Romidepsin and cultured in the absence or the presence of autologous NK cells treated with Nano-PIC-MDDCs and either IgG Isotypic control or with anti-TRAIL antibodies. Data are represented in Box and Whiskers plots showing median and maximum and minimum values in error bars. Statistical significance was calculated using a Friedman anova and Dunn´s post-hoc test for multiple comparisons. *P < 0.05; **P < 0.01; ***P < 0.001. Source data are available online for this figure.
Figure 6
Figure 6. Dynamics of adaptive NKG2C + NK cell subsets and immune-checkpoint expression in a humanized BLT mice during HIV-1 infection.
(A, B) Proportions of precursor adaptive NKG2C+ CD57− (A), mature adaptive NKG2C+ CD57+ (B) subsets within circulating CD56dim CD16+ NK populations in n = 6 hBLT mice after 1 and 2 weeks of infection with HIV-1 JRCSF (green). Data from n = 5 uninfected hBLT mice (gray) analyzed in parallel at the same time points are also shown. Data are represented in Box and Whiskers plots showing median and maximum and minimum values in error bars. (C) Spearman correlation between expression of TIGIT in circulating NKG2C+ CD57- precursor within CD56dim CD16+ NK and plasma viral load in n = 8 infected hBLT mice after 1 week. (D) Ratio between proportions of TIM3+ vs TIGIT+ in adaptive NKG2C+ CD57- precursors in hBLT model at 1 and 2 weeks post-HIV-1 JRCSF infection, as previously defined in (A, B). Data are represented in Box and Whiskers plots showing median and maximum and minimum values in error bars. Statistical significance was calculated using a Mann–Whitney test and Bonferroni correction for multiple comparisons. *P < 0.05. Source data are available online for this figure.
Figure 7
Figure 7. Blockade of TIGIT enhances NK-NanoPIC-MDDC immunotherapy against HIV-1-infected CD4+ T cells from PWH in vivo in transplanted NSG mice.
(A) Schematic representation of experimental humanized NSG mouse model and the different NanoPIC-MDDC-NK immunotherapy, and treatment with either Isotypic control and anti-TIGIT mAbs. Number of total combined mice from n = 3 independent experiments. (B) Proportions of HIV-1 p24+ cells within CD4 + T cells in the peripheral blood (n = 12, left plot) and spleen (n = 12, right plot) of NSG mice transplanted with CD4 + T cells from PWH alone (black) or in combination with autologous NK cells and Nano-PIC-MDDCs and injected with either Isotypic (n = 13 blood and n = 14 spleen; violet) or anti-TIGIT (n = 14 blood and n = 12 spleen; blue,) mAbs. Data are represented in Box and Whiskers plots showing median and maximum and minimum values in error bars. (C) Analysis of size of clusters of p24+ cells present in the spleen of transplanted NSG mice with CD4+ T cells from PWH alone (n = 12; black) or in combination with autologous NK cells and Nano-PIC-MDDC and injected with either isotypic (n = 11; violet) or anti-TIGIT (n = 11; blue) mAbs. A representative confocal microscopy image showing expression of p24 (white) and granzyme B (red) is shown in the left. p24 cluster areas in tissue are highlighted with white circles. Scale bar: 50 μm. (D) Quantification of granzyme B+ cells around and within areas of low and high p24+ clusters in spleen from transplanted NSG mice receiving NK-Nano-PIC-MDDC and isotype (n = 10; violet) or anti-TIGIT (n = 11; blue) immunotherapy corrected by the total area of tissue analyzed. Data are represented in Box and Whiskers plots showing median and maximum and minimum values in error bars. Statistical significance between different experimental groups was calculated using a two-tailed Mann–Whitney test and Bonferroni correction for multiple comparisons. *P < 0.05; **P < 0.01; ***P < 0.001. Source data are available online for this figure.
Figure 8
Figure 8. Enrichment of NKG2C adaptive NK precursors and expression of TRAIL involved in HIV-1-infected CD4+ T cells elimination after NK-NanoPIC-MDDC immunotherapy and blockade of TIGIT in a in vivo PWH transplanted NSG mice.
(A) Analysis of proportions of NKG2C+ CD57- precursors and NKG2C+ CD57+ mature memory NK cells from hCD45+ CD56+ cells present in the spleen of humanized NSG mice treated with isotype (n = 14; violet) or anti-TIGIT (n = 12; blue) antibodies. Data are represented in Box and Whiskers plots showing median and maximum and minimum values in error bars. Pie chart representing quantification of proportions of each population within the total NKG2C+ population is also shown on the left. Median proportions of adaptive NK subsets present on PWH donors prior to mVOA (Pre-mVOA) was included. (B) Representative ×40 magnification confocal microscopy images showing co-expression of NKG2C (green) and TRAIL (red) individually and merged in the spleen of NSG mice receiving anti-TIGIT and isotypic control Abs. Scale bar: 50 μm. (C) Quantification of NKG2C and TRAIL colocalization in the spleen of humanized NSG mice treated with isotype (n = 7; violet) or anti-TIGIT (n = 6; blue) antibodies (upper plot) and spearman correlation of proportions of NKG2C+ TRAIL+ cells and p24+ cluster size in the spleen of both Isotype and anti-TIGIT mice combined (lower plot). Data are represented in Box and Whiskers plots showing median and maximum and minimum values in error bars. Statistical significance between different experimental groups was calculated using either a two-tailed Mann–Whitney test or a Chi-square test. *P < 0.05; **P < 0.01. Source data are available online for this figure.
Figure EV1
Figure EV1. Phenotypical analysis of MDDC from healthy donors and PWH in presence of soluble or nanoparticle-encapsulated Poly I:C.
(A) Representative flow cytometry gating strategy defining viable big size HLA-DR + , CD14lo/-, CD11c+ and CD1a+ MDDC generated from Mo in the presence of GM-CSF and IL-4. (B) Proportions of live viability dye negative MDDCs from n = 8 HD (left panel) and n = 8 PWH (right panel). (C) Representative flow cytometry dot plots showing expression of CD86 vs intracellular staining of IFNβ in MDDCs from PWH cultured in media and after soluble (Sol PIC) or Nanoparticle (Nano PIC) -Poly I:C treatments. FMO for IFNβ is shown (left). Analysis of proportions of MDDCs from HD (n = 8; left) and PWH (n = 9; right) expressing intracellular IFNβ after 6 h of stimulation with soluble (Sol) or nanoparticle encapsulated poly: IC (Nano-PIC). (D) Analysis of IL-2, IL-12, IL-6, Il-15, IFNβ, IFNγ and TNFα, concentrations (pg/ml) present in culture supernatants of MDDCs from HD (left) an PWH (right) at 16 h in the mentioned conditions. (E) Basal mean fluorescence intensity (MFI) of CD86 (left) and CD40 (right) on MDDCs from n = 15 or n = 8 HD and n = 13 or n = 7 PWH, respectively. (FH): MFI levels of CD86 (F) on MDDCs from n = 15 HD (left panel) and n = 17 PWH (right panel) at 6 h (F) or CD40 after 6 (G) and 16 h (H) of culture from n = 7 and n = 7 HD or n = 8 and n = 10 PWH, respectively, in basal conditions and after Sol PIC or nano empty or loaded with PIC treatments. Data in (BH) are presented in Box and Whiskers plots showing median values and maximum and minimum error bars. Statistical significance between experimental conditions in the same samples were calculated using a two-tailed Wilcoxon tests and Bonferroni correction for multiple comparisons. *P < 0.05; **P < 0.01; ***P < 0.001.
Figure EV2
Figure EV2. Functional restoration of NK from PWH eliminating HIV-1-infected CD4+ T cells after treatment with Nano-PIC-MDDC.
(A) Raw data and fold change in proportions of HIV-1 p24+ CD4+ T cells from all n = 33 PWH recruited for the study cultured with Romidepsin and Raltegavir in the absence or the presence of autologous NK cells alone or stimulated with Nano-empty or Nano-PIC-MDDC. (B) Proportions of HIV-1 p24+ CD4+ T cells in the presence of NK cells stimulated with Nano-PIC-MDDC from three separate effective responder (Effect. R; n = 13), unclassified (Unclas. R. n = 7) and non-responder (Non-R.; n = 13) PWH groups. (C) Representative flow cytometry dot plots showing intracellular expression of p24 in Nano-PIC-MDDC (upper plot) or co-cultured autologous CD4 + T cells (lower plot) from a tested PWH. (D) Proportions of HIV-1 p24+ cells analyzed by FACS (left plots, light blue) and IPDA analysis of intact (dark blue) or defective (gray) HIV-DNA in CD4+ T cells from n = 4 PWH cultured with Romidepsin and Raltegravir in the absence or the presence of autologous NK cells alone or stimulated with Nano-PIC-MDDC. (E) Proportions of NKG2C- CD57+ subset on CD56dim or CD56lo/- CD16 + NK from effective responder (n = 13, Effect. R; blue), unclassified (n = 7, Unclas. R; gray) and non-responder (n = 13, Non-R.; pink) PWH after activation with Nano-PIC-MDDC. (F) Proportions of total CD107a+ (left), total FNγ+ (right) and total TNFα+ (below) included in gated memory NK precursors NKG2C + CD57−, memory differentiated NKG2C + CD57+ and effector NKG2C− CD57+ subsets from n = 10 selected effective responder PWH after Nano-PIC-MDDCs in presence of PMA and Ionomycin stimulation for 4 h and Brefeldin A and Monensin. Data from (A, B, E, F) are presented in Box and Whiskers plots showing median values and maximum and minimum error bars. The data in (D) are represented with bar plots. Statistical Significance was calculated using a Friedman or a Kruskal–Wallis test for multiple comparisons. *P < 0.05; **P < 0.01; ***P < 0.001.
Figure EV3
Figure EV3. Proportions of p24+ CD4+ T cells after TIGIT and TIM3 blocking antibody.
(A, B) Proportions of CD4+ T cells expressing HIV-1 p24+ cells cultured alone or with NK treated with Nano-PIC-MDDC from n = 9 effective responder PWH (A) or just media from n = 6 non-responder PWH (B) in the presence of isotypic control or anti-TIGIT mAbs. (C) Analysis of impact of blocking anti-TIM3 mAbs in experiments performed under the same conditions as (A) using n = 8 total PWH (left) or stratified based on effective (n = 4, middle) and non-responders (n = 4, right) donors. (D) Proportions of CD107a+ IFNγ + CD56 + NK cells in the co-culture experimental conditions described in (C) in the three responder PWH groups previously mentioned. (E) Proportions of p24+ cells in CD4+ T cells from n = 7 PWH treated with isotypic control or anti-TIGIT mAbs in the presence of media alone (basal) or under reactivation conditions with PHA (PHA). Baseline ex vivo levels of p24+ cells form these PWH are shown in the gray box and whisker bar. Data are presented in Box and Whiskers plots showing median values and maximum and minimum error bars. Statistically significant differences were calculated using a Friedman test for multiple comparisons and in the (B) was calculated using a one tailed Wilcoxon test and Bonferroni correction was applied. *P < 0.05; ***P < 0.001.
Figure EV4
Figure EV4. Analysis of expression of NK receptor ligands on p24- vs p24+ CD4+ T cells and TRAIL on NK cell subsets from different PWH and its association with functionality.
(A) Representative flow cytometry dot plots for the NK receptor ligands MIC/ab (NKG2D), HLA-E (NKG2C/A) and DR4 (TRAIL), in gated p24+ or p24- CD4 + T cells from PWH after 16h culture with PHA + IL-2. A FMO control is included to each NK ligand. (B) Representative Flow cytometry dot plot showing expression of TRAIL on total CD56dim CD16+ NK, total NKG2C-, NKG2C+ CD57- and NKG2C+ CD57+ NK from a representative effective responder PWH. (C) Fold change in proportions of TRAIL+ cells in NKG2C- (left) and adaptive NKG2C+ CD57- (middle) and NKG2C+ CD57+ (right) subsets after Nano-PIC-MDDC from effective responder (n = 10; Effect. R; blue), unclassified (n = 6; Unclas. R; gray) and non-responder (n = 8; Non-R.; pink) PWH included on CD56lo/- CD16 + NK. (D) Raw proportions of TRAIL+ cells within adaptive NKG2C+ CD57+ and NKG2C+ CD57− cell subsets in the same responders PWH groups defined in (C) included in CD56dim CD16+ NK subpopulation after stimulation with Nano-PIC-MDDC. Statistical significance was calculated using a Mann–Whitney test and Bonferroni correction. (E, F) Ratio of TIGIT+ versus TRAIL+ cells in precursor NKG2C+ CD57- adaptive (E) and mature NKG2C + CD57+ (F) cells in CD56dim (left) and CD56lo/− (right) CD16 + NK subsets from the same PWH responder groups. Statistical significance was calculated using a one tale Mann–Whitney test and Bonferroni correction. (G, H) Proportions of HIV-p24 + CD4 + T cells from n = 6 (G) and n = 7 (H) PWH previously identified as effective responders treated with Raltegravir and Romidepsin and cultured in the absence or the presence of autologous unstimulated NK cells or NK treated with Nano-PIC-MDDCs in the presence of either IgG Isotypic control or with anti-TRAIL blocking mAb (G) or in the presence of anti-NKG2C mAb (H). Statistical significance was calculated using a one tale Wilcoxon matched pairs test and Bonferroni correction or a Friedman test for multiple comparisons. (I) Spearman correlations between proportions of TIM3 and TRAIL after Nano-PIC-MDDC within CD56dim (upper) and CD56lo/− (bottom) CD16 + NK. Statistical P and R values considering all data (black), without unclassified group (gray). (J) Analysis of proportions of TRAIL+ cells within adaptive NKG2C + CD57 + NK from n = 7 PWH stimulated with Nano-PIC-MDDC in the presence of isotype or anti-TIM3 mAb. Statistical significance was calculated were calculated using a two-tailed Wilcoxon matched pairs. Data from (CH, J) are presented in Box and Whiskers plots showing median values and maximum and minimum error bars. *P < 0.05; **P < 0.01; ***P < 0.001; ****P < 0.0001.
Figure EV5
Figure EV5. Analysis of impact of anti-TIGIT antibodies on HIV-1 reactivation and in reconstitution and histological patterns in humanized NSG mice transplanted with NK cells.
(A) Representative flow cytometry gating strategy showing identification of human CD45+ cells from PWH transplanted into immunodeficient NSG mice, and the identification of CD4+ CD3+ T cells. (B) Total absolute numbers of human CD45+ (left) and CD4+ T cells (right) in the peripheral blood and spleen from NSG mice transplanted either with CD4 + T cells from PWH alone (black) or in combination with autologous NK and Nano-PIC-MDDC and injected with either Isotypic (violet) or anti-TIGIT (blue). Data from n = 3 independent experiments using different PWH donors is shown. (C) Analysis of HIV-1 plasma viral load on plasma of transplanted NSG mice receiving either only CD4 + T cells from PWH or Nano-PIC-MDDC-NK immunotherapy and either Isotypic or anti-TIGIT mAbs. A positive control from cells from PWH is also shown. (D) Representative examples of levels of intracellular HIV-1 p24 on gated circulating human CD4 + CD3+ transplanted into mice and showing undetectable, low, intermediate and high p24 detection. (E) Proportions of HIV-1 p24+ cells within CD4 + T cells in the peripheral blood (left plot) and spleen (right plot) of NSG mice transplanted with CD4 + T cells from PWH alone (black) or in combination with autologous NK cells and Nano-PIC-MDDCs and injected with either Isotypic (violet) or anti-TIGIT (blue) mAbs for each donors 1, 2 and 3 (d1, d2, d3) used on each independent experiment. (F) Representative confocal microscopy images showing immunofluorescence histological analysis of a spleen tissue section from a representative transplanted NSG mouse showing staining of HIV-1 p24 (white) and granzyme B (red) showing areas with areas of high p24 cluster concentration (orange) and individual p24 clusters (white). Quantification of individual cluster cells with p24 (upper right) and granzyme B (lower right) staining masks are shown. Scale bar: 100 μm. (G) Analysis of size of clusters of p24+ cells present in the spleen of NSG mice transplanted with the three different d1, d2, d3 PWH as previously described in (E). In panel (B, E, G) data are presented in Box and Whiskers plots showing median values and maximum and minimum error bars. Statistical significant differences between the different groups of treatment were calculated using a two tail Mann–Whitney test and Bonferroni correction for multiple comparisons. *P < 0.05.

Similar articles

References

    1. Abner E, Jordan A (2019) HIV ‘shock and kill’ therapy: In need of revision. Antivir Res 166:19–34 - PubMed
    1. Abuharfeil NM, Yaseen MM, Alsheyab FM (2019) Harnessing antibody-dependent cellular cytotoxicity to control HIV-1 infection. ACS Infect Dis 5:158–176 - PubMed
    1. Acchioni C, Palermo E, Sandini S, Acchioni M, Hiscott J, Sgarbanti M (2021) Fighting HIV-1 persistence: at the crossroads of ‘Shoc-K and B-Lock’. Pathogens 10:1517 - PMC - PubMed
    1. Adams P, Fievez V, Schober R, Amand M, Iserentant G, Rutsaert S, Dessilly G, Vanham G, Hedin F, Cosma A et al (2021) CD32+CD4+ memory T cells are enriched for total HIV-1 DNA in tissues from humanized mice. iScience 24:101881 - PMC - PubMed
    1. Alrubayyi A, Rowland-Jones S, Peppa D (2022) Natural killer cells during acute HIV-1 infection: clues for HIV-1 prevention and therapy. AIDS 36:1903–1915 - PMC - PubMed

MeSH terms