

Influence of road and traffic conditions on emissions and fuel consumption of light vehicles in a real urban driving cycle
- PMID: 40473880
- PMCID: PMC12202684
- DOI: 10.1007/s11356-025-36573-3
Influence of road and traffic conditions on emissions and fuel consumption of light vehicles in a real urban driving cycle
Abstract
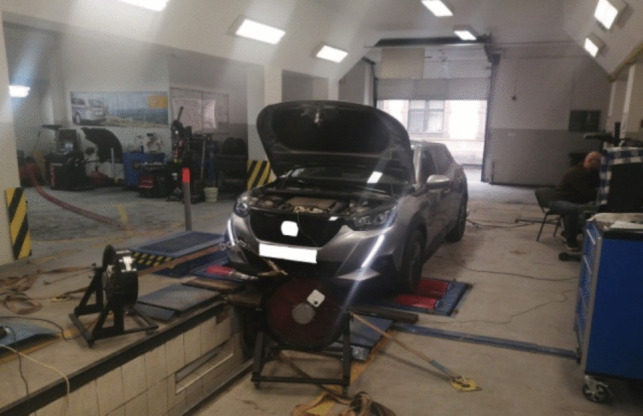
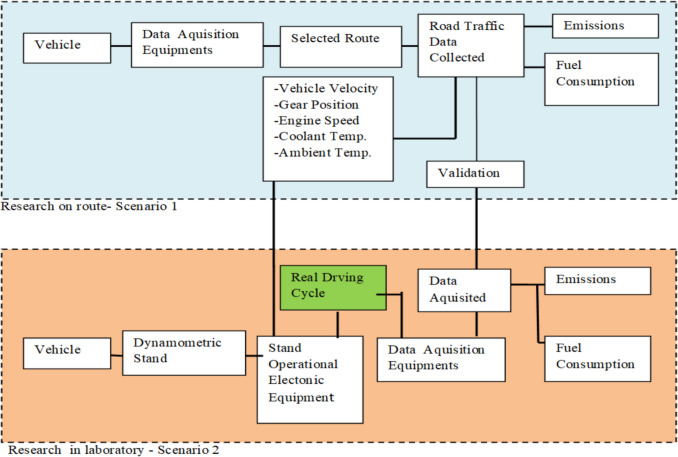
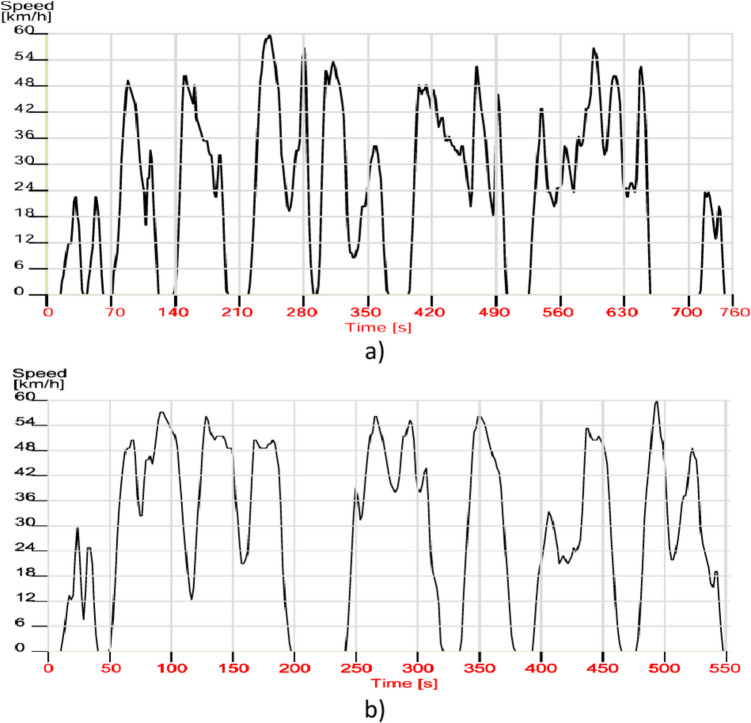
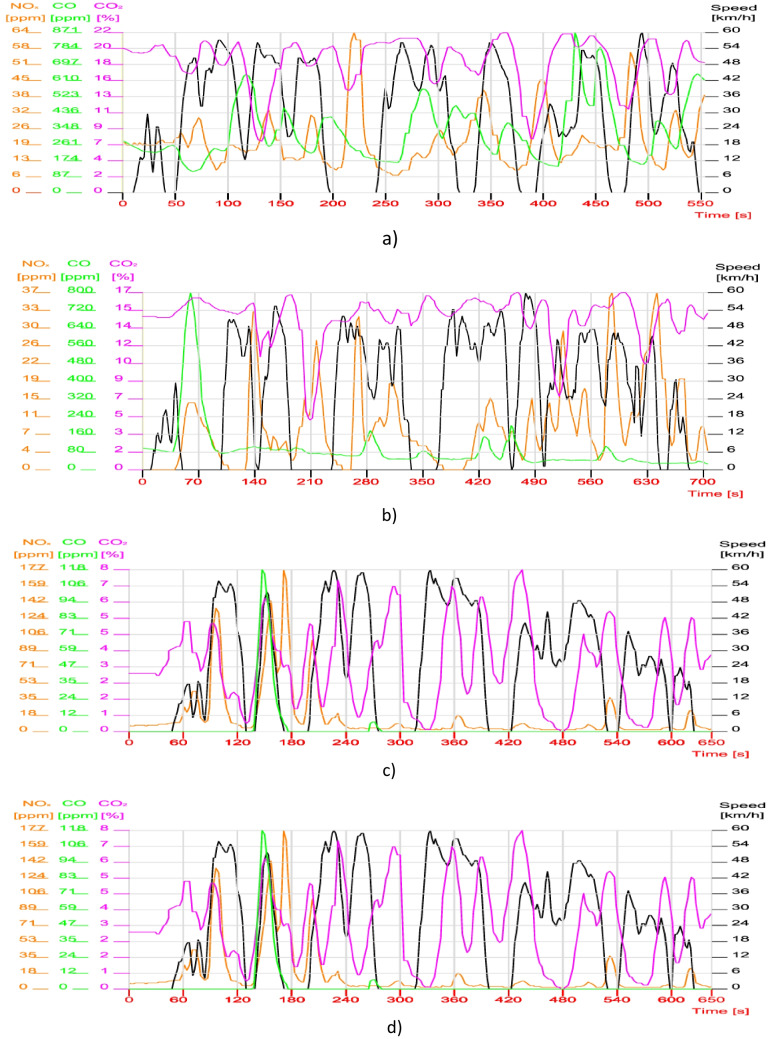
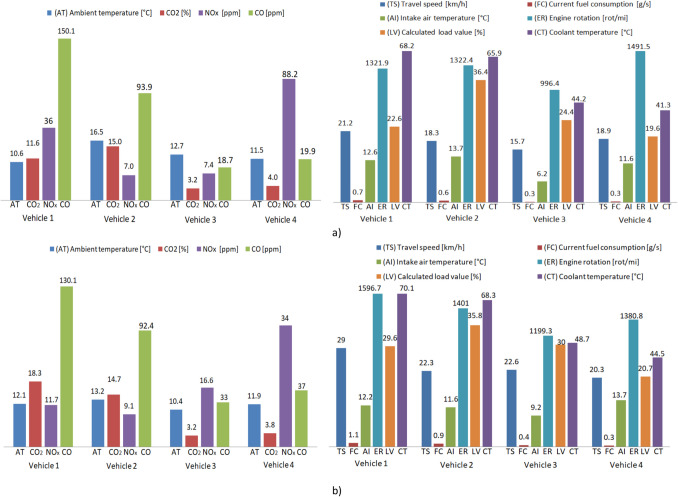
Over time, international decision-making bodies have paid a special attention to the adoption of test driving cycles in the laboratory that reflect standard traffic conditions and regulations regarding the maximum limit of pollutant emissions from road vehicles to be homologated for their admittance to traffic. The proposed study examines the impact of road and traffic characteristics on pollutant emissions and fuel consumption of light vehicles in a real urban traffic cycle. The research was carried out following two scenarios, in two phases, each of them focusing on the analysis of greenhouse gas emissions mainly (CO2), nitrogen oxides (NOx), and carbon monoxide (CO) from motor vehicles with both petrol and diesel. Simultaneously, the fuel consumption of these vehicles was also evaluated. In the first scenario, the objective was to collect real data on road and traffic characteristics through tests on a carefully selected urban route in two phases: noon (light traffic) and evening (congested traffic). In the second scenario, data from both phases were used to generate two driving cycles simulating real conditions for vehicle testing on the stand; thus, four different cars were used. The research results obtained both by traveling the chosen route and by virtually traveling the same route by using real driving cycles allow a complex analysis of the interaction of different types of cars (Standard EURO 6) with the surrounding environment in traffic conditions that can lead to improve substantial effects of impacts on its various components.
Keywords: Dynamic cycles; Fuel consumption; Pollutant emissions; Real traffic; Traffic intensity.
© 2025. The Author(s).
Conflict of interest statement
Declarations. Ethical approval: This is not applicable for that specific section. Consent to participate: All participants provided informed consent to participate in the study. Consent for publication: Participants who granted consent for publication are included in this research paper. Competing interests: The authors declare no competing interests.
Figures


References
-
- Ahn K, Rakha H (2009) A field evaluation case study of the environmental and energy impacts of traffic calming. Transp Res Part D: Transp Environ 14(6):411–424. 10.1016/j.trd.2009.01.007 - DOI
-
- Cofaru C (2007) Transport and environmental engineering. Transilvania University Press of Brașov. ISBN:978–973–598–066–5, (pp. 103)
-
- Cofaru C (2012) Environmental engineering and legislation. Transilvania University Press of Brașov, pp 80
Publication types
MeSH terms
Substances
LinkOut - more resources
Full Text Sources
