Review
. 2025 Jun;42(6):891-906.
doi: 10.1007/s11095-025-03878-4. Epub 2025 Jun 5.

The Finite Absorption Time Concept Guiding Model Informed Drug & Generics Development in Clinical Pharmacology

Affiliations
Review

The Finite Absorption Time Concept Guiding Model Informed Drug & Generics Development in Clinical Pharmacology

Panos Macheras et al. Pharm Res. 2025 Jun.

Abstract

Purpose: To show the implications of the incorporation of the Finite Absorption Time (F.A.T.) concept in drug development plans and in generics development and assessment and to examine regulatory implications.

Methods: Reexamining and reanalyzing published pharmacokinetic data using the pertinent models that are based on F.A.T.

Results: Comparing absorption metrics, old and new ones, shows distinct advantages and better accuracy for those based on the F.A.T.

Conclusion: The proposed approaches can be applied successfully in all phases of drug/generics development and guide changes in their strategy and in the relevant regulatory framework.

Keywords: Bioequivalence; Finite absorption time; IVIVC; Oral drugs; Pharmacokinetics; Physiologically based finite time pharmacokinetic models.


Conflict of interest statement

Declarations. Conflicts of Interest: The authors declare no conflicts of interest.

Figures

Fig. 1
Fig. 1
(A) Currently used studies in early phase of drug development in chronological order. (B) Proposed additional F.A.T. driven Phase I studies followed by enriched PBPK modeling work. (C) Future developments: Towards a predictive experimental device, the “3D absorption map” era and the predictive absorption models based on molecular structure using machine learning techniques.
Fig. 2
Fig. 2
A paradigm shift in oral drug absorption. (A) Currently, the percent absorbed A% versus time curves follow a mono-exponential pattern based on the prevailing hypothesis of first-order absorption kinetics. (B) Linear percent absorbed versus time plot in accord with the F.A.T. concept assuming one input stage [27]. (C) Percent absorbed versus time curve for almotriptan with two linear absorption segments (redrawn from Fig. 8 in [15] using Eq. 6 from Ref. [27]). (D) Percent absorbed versus time curve for cyclosporine reference product under fed conditions exhibiting three linear absorption segments (data replotted from Fig. 9D in [15] using Eq. 6 from Ref. [27]).
Fig. 3
Fig. 3
Best fit results of the PBFTPK model [15] with one input stage assuming one-compartment model disposition to alendronate experimental blood data [29]. The symbol ▲ denotes the end of the absorption processes. Vd is the volume of drug distribution and kel is the elimination rate constant.
Fig. 4
Fig. 4
(A) PBFTPK model nonlinear fitting [13] with one input stage and two-compartment model disposition to doxycycline data [45]. The symbol ▲ denotes the end of the absorption process. (B) Fitting using a custom code written in Wolfram Language (Mathematica version 14.2) to methylprednisolone data [46] after the intramuscular administration of methylprednisolone acetate, which is a pro-drug of methylprednisolone; the equation Ct=e-keltt-λn0tλ-ktE1λ,-kelt where E1(λ,x) is the Exponential Integral function, which is the analytical solution of the ODE: dCdt=kt-λ-kelC was used. Best fitting results, k = 14.36 ng mL−1 h−0.56, λ = 0.44, kel = 0.179 h−1 and correlation coefficient, R.2 = 0.958.
Fig. 5
Fig. 5
Visual predictive check in children’s following once daily dosing regimen; observed data are plotted using a circle. The dashed lines represent the 5th and 95th percentiles of simulated data (n = 1000). The continuous lines represent the 50th percentile of simulated data (n = 1000).
Fig. 6
Fig. 6
Normalized prediction distribution errors (NPDE) analysis. (A) NPDE vs. time. (B) NPDE vs. population prediction concentrations (PRED). (C) Histogram of the distribution of the NPDE, with the density of the standard Gaussian distribution overlaid. (D) QQ-plot of the distribution of the NPDE vs. the theoretical normal distribution.
Fig. 7
Fig. 7
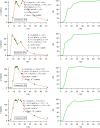
Best fitting results of PBFTPK models to mesalazine data [59]; each plot is followed by the corresponding percent absorbed versus time curve calculated using Eq. 2 from Ref. [27]. The meaning of symbols can be found in [59]. R1, R2, R3, R4 denote rate of input at each input stage.
Fig. 7
Fig. 7
Best fitting results of PBFTPK models to mesalazine data [59]; each plot is followed by the corresponding percent absorbed versus time curve calculated using Eq. 2 from Ref. [27]. The meaning of symbols can be found in [59]. R1, R2, R3, R4 denote rate of input at each input stage.
Fig. 8
Fig. 8
Best fitting results of PBFTPK models to efodipine data [60]; each plot is accompanied by the corresponding percent absorbed versus time curve calculated using Eq. 6 from Ref. [27]. The meaning of symbols can be found in [60].
Fig. 9
Fig. 9
Model-depended approach: PBFTPK model fittings to cyclosporine data under fasted conditions [15] for reference (A) and test (B); R1 denotes the rate of input. Model independent approach: Percent absorbed versus time curves (calculated using Eq. 6 from Ref. [27]) for reference (C) and test (D) studied under fasted conditions [15] and the corresponding plot (Ε) for the ratio test/reference of the amount absorbed for the assessment of extent of absorption. The plot of the ratio (test/reference) of areas under the curve was calculated directly from the experimental data as a function of time (F).

Similar articles

References

    1. Marrer E, Baty F, Kehren J, Chibout SD, Brutsche M. Past, present and future of gene expression-tailored therapy for lung cancer. Per Med. 2006;3:165–75. 10.2217/17410541.3.2.165. - PubMed
    1. Hong KW, Bermseok O. Overview of personalized medicine in the disease genomic era. BMB Rep. 2010;43:643–8. 10.5483/BMBRep.2010.43.10.643. - PubMed
    1. Vitti TG, Banes D, Byers TE. Bioavailability of Digoxin. N Engl J Med. 1971;285:1433. 10.1056/nejm197112162852512. - PubMed
    1. Skelly JP. The history of biopharmaceutics in Food and Drug Administration 1968–1993. AAPS J. 2010;12:44–50. 10.1208/s12248-009-9154-8. - PMC - PubMed
    1. FDA. On January 7, 1977, FDA issued final regulations in part 320 (21 CFR 320) establishing definitions and requirements for BA and BE studies (42 FR 1624).

LinkOut - more resources