

Detecting genetic interactions with visible neural networks
- PMID: 40473911
- PMCID: PMC12141535
- DOI: 10.1038/s42003-025-08157-x
Detecting genetic interactions with visible neural networks
Abstract
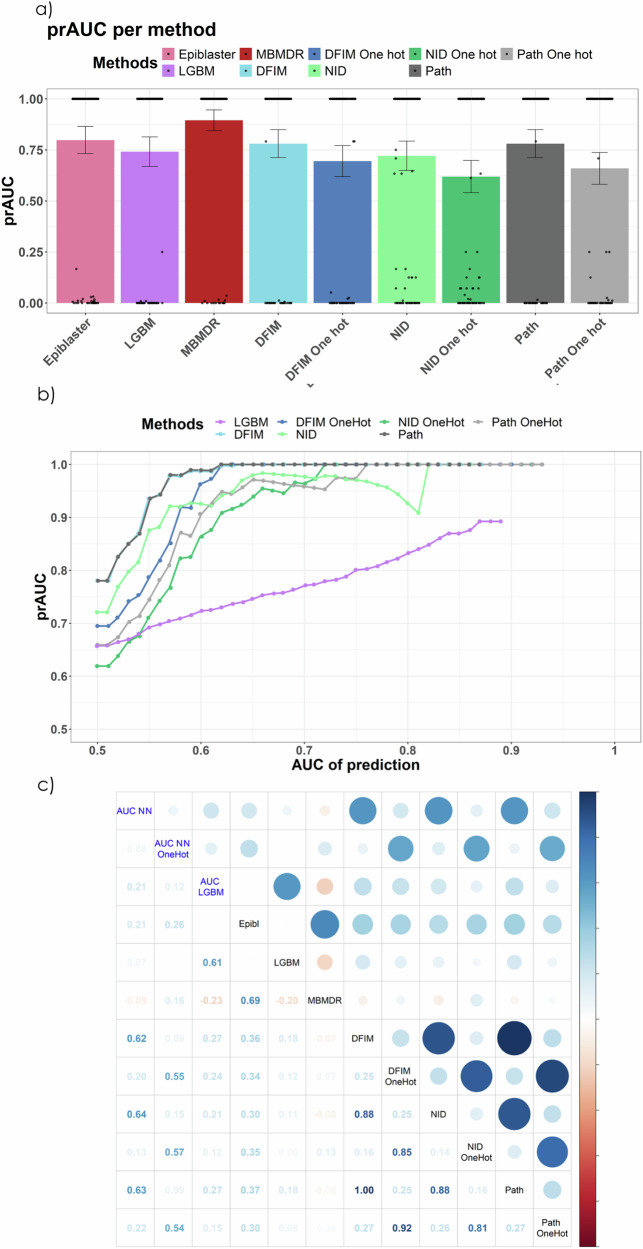
Non-linear interactions among single nucleotide polymorphisms (SNPs), genes, and pathways play an important role in human diseases, but identifying these interactions is a challenging task. Neural networks are state-of-the-art predictors in many domains due to their ability to analyze big data and model complex patterns, including non-linear interactions. In genetics, visible neural networks are popular as they provide insight into the most important SNPs, genes, and pathways for prediction. Visible neural networks use prior knowledge (e.g., gene and pathway annotations) to define node connections in the network, making them sparse and interpretable. Currently, most of these networks provide measures for the importance of SNPs, genes, and pathways but do not provide information about interactions. In this paper, we explore different methods to detect non-linear interactions with visible neural networks. We adapt and speed up existing methods, create a comprehensive benchmark with simulated data from GAMETES and EpiGEN, and demonstrate that these methods can extract multiple types of interactions from trained neural networks. Finally, we apply these methods to a genome-wide case-control study of inflammatory bowel disease and find high consistency of the epistasis pairs candidates between interpretation methods. The follow-up association test on these candidates identifies seven significant epistasis pairs.
© 2025. The Author(s).
Conflict of interest statement
Competing interests: Wiro Niessen is co-founder and shareholder of Quantib BV. Other authors declare no competing interests.
Figures


Similar articles
-
Distributed transformer for high order epistasis detection in large-scale datasets.Sci Rep. 2024 Jun 25;14(1):14579. doi: 10.1038/s41598-024-65317-5. Sci Rep. 2024. PMID: 38918413 Free PMC article.
-
Eigen-Epistasis for detecting gene-gene interactions.BMC Bioinformatics. 2017 Jan 23;18(1):54. doi: 10.1186/s12859-017-1488-0. BMC Bioinformatics. 2017. PMID: 28114904 Free PMC article.
-
Epi-SSA: A novel epistasis detection method based on a multi-objective sparrow search algorithm.PLoS One. 2024 Oct 24;19(10):e0311223. doi: 10.1371/journal.pone.0311223. eCollection 2024. PLoS One. 2024. PMID: 39446852 Free PMC article.
-
Exploiting the proteome to improve the genome-wide genetic analysis of epistasis in common human diseases.Hum Genet. 2008 Aug;124(1):19-29. doi: 10.1007/s00439-008-0522-8. Epub 2008 Jun 13. Hum Genet. 2008. PMID: 18551320 Free PMC article. Review.
-
Detecting gene-gene interactions that underlie human diseases.Nat Rev Genet. 2009 Jun;10(6):392-404. doi: 10.1038/nrg2579. Nat Rev Genet. 2009. PMID: 19434077 Free PMC article. Review.
Cited by
-
Visible neural networks for multi-omics integration: a critical review.Front Artif Intell. 2025 Jul 17;8:1595291. doi: 10.3389/frai.2025.1595291. eCollection 2025. Front Artif Intell. 2025. PMID: 40746431 Free PMC article.
References
-
- Litjens, G. et al. A survey on deep learning in medical image analysis. Med. image Anal.42, 60–88 (2017). - PubMed
-
- Vaswani, A. et al. Attention is all you need. Advances in neural information processing systems30 (2017).
-
- Young, T., Hazarika, D., Poria, S. & Cambria, E. Recent trends in deep learning based natural language processing. IEE E Comput. Intell. Mag.13, 55–75 (2018).
-
- Lu, Z., Pu, H., Wang, F., Hu, Z. & Wang, L. The expressive power of neural networks: A view from the width. Adv. Neural Info. Proc. Syst.30 (2017).
MeSH terms
LinkOut - more resources
Full Text Sources
