. 2025 Jun 5;8(1):878.
doi: 10.1038/s42003-025-08323-1.

Distinct functional domains of Dystroglycan regulate inhibitory synapse formation and maintenance in cerebellar Purkinje cells

Affiliations

Distinct functional domains of Dystroglycan regulate inhibitory synapse formation and maintenance in cerebellar Purkinje cells

Jennifer N Jahncke et al. Commun Biol. .

Abstract

Dystroglycan is a cell adhesion molecule that localizes to synapses throughout the nervous system. While Dystroglycan is required to maintain inhibitory synapses from cerebellar molecular layer interneurons (MLIs) onto Purkinje cells (PCs) whether initial synaptogenesis during development is dependent on Dystroglycan has not been examined. We show that mice with conditional deletion of Dystroglycan from Purkinje cells prior to synaptogenesis results in impaired MLI:PC synapse formation and function due to reduced presynaptic inputs and abnormal postsynaptic GABAA receptor clustering. Using genetic manipulations that disrupt glycosylation of Dystroglycan or truncate its cytoplasmic domain, we show that Dystroglycan's role in synapse function requires both extracellular and intracellular interactions, whereas synapse formation requires only extracellular interactions. Together, these findings provide molecular insight into the mechanism of inhibitory synapse formation and maintenance in cerebellar cortex.


Conflict of interest statement

Competing interests: The authors declare no competing interests.

Figures

Fig. 1
Fig. 1. Dystroglycan co-localizes with markers of inhibitory synapses.
Cerebellar cortex of lobules V–VI was immunostained with Parvalbumin to show Purkinje cell and MLI morphology and counterstained with IIH6 (glycosylated Dystroglycan) and GAD67 (A) or VGAT (C). Both the merged channels (IIH6, green; GAD67/VGAT, magenta) and colocalized pixels are shown for the original image and for the original IIH6 with the mirrored GAD67/VGAT channel. Images are maximum projections. B, D Quantification of the percent of IIH6 puncta that are colocalized with GAD67/VGAT puncta. Scale bar for (A, C) is 50 μm; scale bar for insets (A’, C’) is 25 μm. GAD67 N = 3 animals, p = 8.87E-04. VGAT N = 4 animals, p = 9.98E-05.
Fig. 2
Fig. 2. Impaired inhibitory synapse function in Calb1Cre;Dag1cKO Purkinje cells.
A Average mIPSC event. B Representative 15 s trace of mIPSCs. mIPSC amplitude (C) and frequency (D); error bars are presented as mean + SEM. Cumulative frequency histogram for individual mIPSC amplitudes (E) and inter-event intervals (IEI) (F). Calb1Cre;Dag1Ctrl N = 16 cells, 6 animals; Calb1Cre;Dag1cKO N = 16 cells, 6 animals; pAmp = 0.017, pFreq = 0.018.
Fig. 3
Fig. 3. Inhibitory pre- and postsynaptic markers are altered in Calb1Cre;Dag1cKO cerebellar cortex.
Tissue sections from cerebellar vermis of Calb1Cre;Dag1cKOs (B) and littermate controls (A) were immunostained for Calbindin to visualize Purkinje cells along with the presynaptic marker VGAT (magenta) and postsynaptic GABAA receptor subunit GABAAα1 (green). The first panel shows a low-magnification view of the Calbindin channel. Subsequent panels are magnified views of the yellow outlined region in the first panel. Images are maximum projections. C Quantification of VGAT (left) and GABAAα1 (right) puncta density (per 100 μm3) for dendritic (“Molecular Layer”) and somatic compartments. Error bars are presented as mean + SEM. pVGAT_ML = 0.002, pVGAT_Soma = 2.48E-05, pGABAAα1_ML = 0.003, pGABAAα1_Soma = 0.003. D Quantification of VGAT (left) and GABAAα1 (right) puncta size (in μm3) for the dendritic compartment. pVGAT = 0.778, pGABAAα1 = 0.969. Calb1Cre;Dag1Ctrl N = 5 animals. Calb1Cre;Dag1cKO N = 4 animals.
Fig. 4
Fig. 4. Developmental disruption in inhibitory pre- and postsynaptic markers in P12 Calb1Cre;Dag1cKO cerebellar cortex.
Tissue sections from cerebellar vermis of P12 Calb1Cre;Dag1cKOs (B) and littermate controls (A) were immunostained for Calbindin to visualize Purkinje cells along with the presynaptic marker VGAT (magenta) and postsynaptic GABAA receptor subunit GABAAα1 (green). The first panel shows a low-magnification view of the Calbindin channel. Subsequent panels are magnified views of the yellow outlined region in the first panel. Images are maximum projections. C Quantification of VGAT (left) and GABAAα1 (right) puncta density (per 100 μm3) for dendritic (“Molecular Layer”) and somatic compartments. Error bars are presented as mean + SEM. pVGAT_ML = 0.062, pVGAT_Soma = 0.010, pGABAAα1_ML = 0.009, pGABAAα1_Soma = 0.006. D Quantification of VGAT (left) and GABAAα1 (right) puncta size (in μm3) for the dendritic compartment. pVGAT = 0.495, pGABAAα1 = 0.029. Calb1Cre;Dag1Ctrl N = 4 animals. Calb1Cre;Dag1cKO N = 4 animals.
Fig. 5
Fig. 5. Impaired inhibitory synapse function in Pcp2Cre;Dag1cKO Purkinje cells at P60 but not P30.
AF mIPSC analysis in Pcp2Cre;Dag1cKO and littermate control Purkinje cells at P25–P35. A Average mIPSC event. B Representative 15 s trace of mIPSCs. mIPSC amplitude (C) and frequency (D); error bars are presented as mean + SEM. Cumulative frequency histogram for individual mIPSC amplitudes (E) and inter-event intervals (IEI) (F). GL mIPSC analysis in Pcp2Cre;Dag1cKO and littermate control Purkinje cells at P55–P65. G Average mIPSC event. H Representative 15 s trace of mIPSCs. mIPSC amplitude (I) and frequency (J); error bars are presented as mean + SEM. Cumulative frequency histogram for individual mIPSC amplitudes (K) and inter-event intervals (IEI) (L). P25–P35 Pcp2Cre;Dag1Ctrl N = 13 cells, 5 animals; P25–P35 Pcp2Cre;Dag1cKO N = 9 cells, 5 animals; pAmp = 0.794, pFreq = 0.431. P55–P65 Pcp2Cre;Dag1Ctrl N = 12 cells, 5 animals; P55–P65 Pcp2Cre;Dag1cKO N = 14 cells, 4 animals; pAmp = 0.040, pFreq = 1.26E-04.
Fig. 6
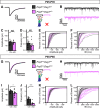
Fig. 6. Impaired inhibitory synapse function in Calb1Cre;Pomt2cKO and Calb1Cre;Dag1cΔICD Purkinje cells.
AF mIPSC analysis in Calb1Cre;Pomt2cKO and littermate control Purkinje cells at P25–P35. A Average mIPSC event. B Representative 15 s trace of mIPSCs. mIPSC amplitude (C) and frequency (D); error bars are presented as mean + SEM. Cumulative frequency histogram for individual mIPSC amplitudes (E) and inter-event intervals (IEI) (F). GL mIPSC analysis in Calb1Cre;Dag1cΔICD and littermate control Purkinje cells at P25–P35. G Average mIPSC event. H Representative 15 s trace of mIPSCs. mIPSC amplitude (I) and frequency (J); error bars are presented as mean + SEM. Cumulative frequency histogram for individual mIPSC amplitudes (K) and inter-event intervals (IEI) (L). Calb1Cre;Pomt2Ctrl N = 11 cells, 3 animals; Calb1Cre;Pomt2cKO N = 10 cells, 4 animals; pAmp = 0.426, pFreq = 0.011. Calb1Cre;Dag1WT N = 13 cells, 4 animals; Calb1Cre;Dag1cΔICD N = 14 cells, 4 animals; pAmp = 5.19E-04, pFreq = 7.28E-04.
Fig. 7
Fig. 7. Inhibitory pre- and postsynaptic markers are altered in Calb1Cre;Pomt2cKO cerebellar cortex.
Tissue sections from cerebellar vermis of Calb1Cre;Pomt2cKOs (B) and littermate controls (A) were immunostained for Calbindin to visualize Purkinje cells along with the presynaptic marker VGAT (magenta) and postsynaptic GABAA receptor subunit GABAAα1 (green). The first panel shows a low-magnification view of the Calbindin channel. Subsequent panels are magnified views of the yellow outlined region in the first panel. Images are maximum projections. C Quantification of VGAT (left) and GABAAα1 (right) puncta density (per 100 μm3) for dendritic (“Molecular Layer”) and somatic compartments. Error bars are presented as mean + SEM. pVGAT_ML = 0.006, pVGAT_Soma = 0.026, pGABAAα1_ML = 0.013, pGABAAα1_Soma = 0.028. D Quantification of VGAT (left) and GABAAα1 (right) puncta size (in μm3) for the dendritic compartment. pVGAT = 0.764, pGABAAα1 = 0.219. Calb1Cre;Pomt2Ctrl N = 3 animals. Calb1Cre;Pomt2cKO N = 3 animals.
Fig. 8
Fig. 8. Inhibitory pre- and postsynaptic markers are relatively normal in Calb1Cre;Dag1cΔICD cerebellar cortex.
Tissue sections from cerebellar vermis of Calb1Cre;Dag1cΔICDs (B) and littermate controls (A) were immunostained for Calbindin to visualize Purkinje cells along with the presynaptic marker VGAT (magenta) and postsynaptic GABAA receptor subunit GABAAα1 (green). The first panel shows a low-magnification view of the Calbindin channel. Subsequent panels are magnified views of the yellow outlined region in the first panel. Images are maximum projections. C Quantification of VGAT (left) and GABAAα1 (right) puncta density (per 100 μm3) for dendritic (“Molecular Layer”) and somatic compartments. Error bars are presented as mean + SEM. pVGAT_ML = 0.575, pVGAT_Soma = 0.018, pGABAAα1_ML = 0.372, pGABAAα1_Soma = 0.044. D Quantification of VGAT (left) and GABAAα1 (right) puncta size (in μm3) for the dendritic compartment. pVGAT = 0.424, pGABAAα1 = 0.719. Calb1Cre;Dag1WT N = 3 animals. Calb1Cre;Dag1cKO N = 3 animals.

Update of

Similar articles

References

    1. Südhof, T. C. Towards an understanding of synapse formation. Neuron100, 276–293 (2018). - PMC - PubMed
    1. Colognato, H. et al. Identification of dystroglycan as a second laminin receptor in oligodendrocytes, with a role in myelination. Development134, 1723–1736 (2007). - PubMed
    1. Nguyen, H. et al. Glial scaffold required for cerebellar granule cell migration is dependent on dystroglycan function as a receptor for basement membrane proteins. Acta Neuropathol. Commun. 1, 58 (2013). - PMC - PubMed
    1. Nickolls, A. R. & Bönnemann, C. G. The roles of dystroglycan in the nervous system: Insights from animal models of muscular dystrophy. DMM Dis. Models Mech.11, dmm035931 (2018). - PMC - PubMed
    1. Tian, M. et al. Dystroglycan in the cerebellum is a laminin α2-chain binding protein at the glial-vascular interface and is expressed in Purkinje cells. Eur. J. Neurosci.8, 2739–2747 (1996). - PubMed

LinkOut - more resources