Multicenter Study
. 2025 Aug;31(8):2622-2631.
doi: 10.1038/s41591-025-03730-7. Epub 2025 Jun 5.

A microRNA-based dynamic risk score for type 1 diabetes

Collaborators, Affiliations
Multicenter Study

A microRNA-based dynamic risk score for type 1 diabetes

Mugdha V Joglekar et al. Nat Med. 2025 Aug.

Abstract

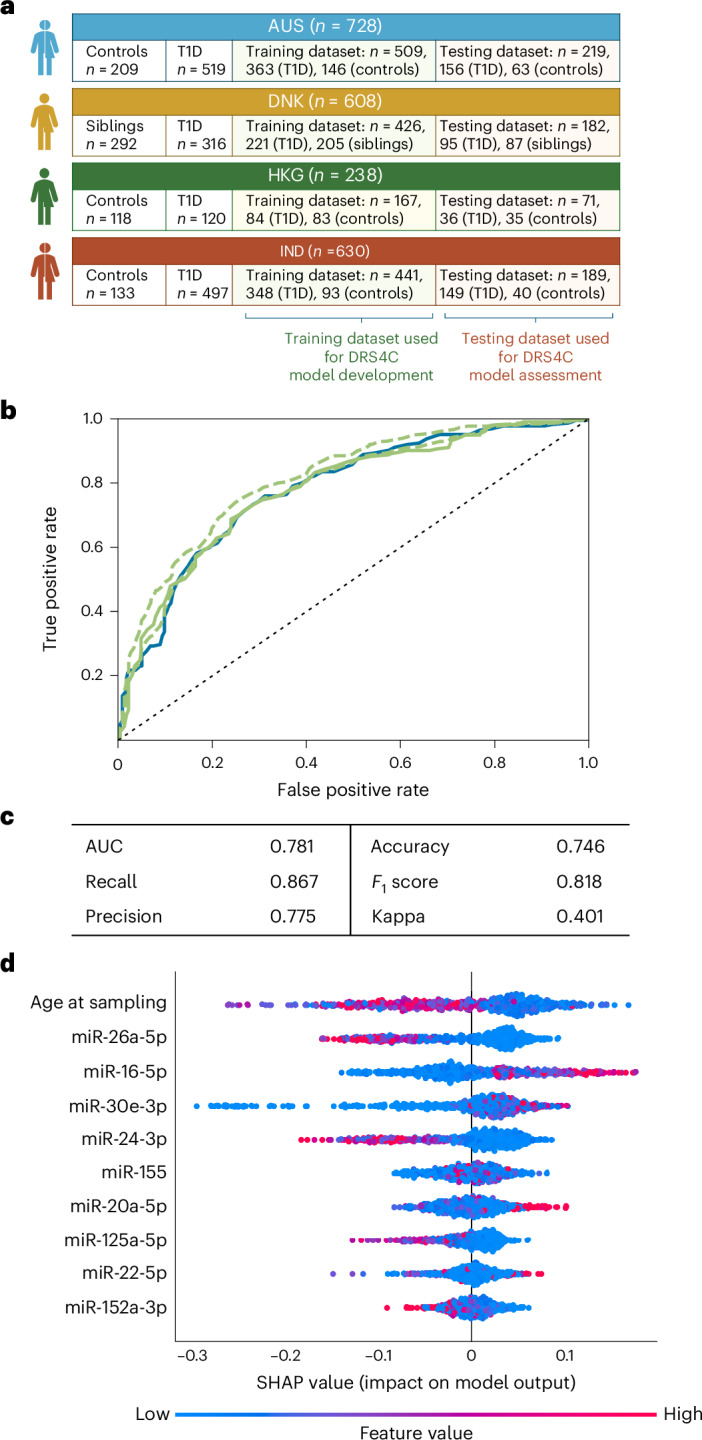
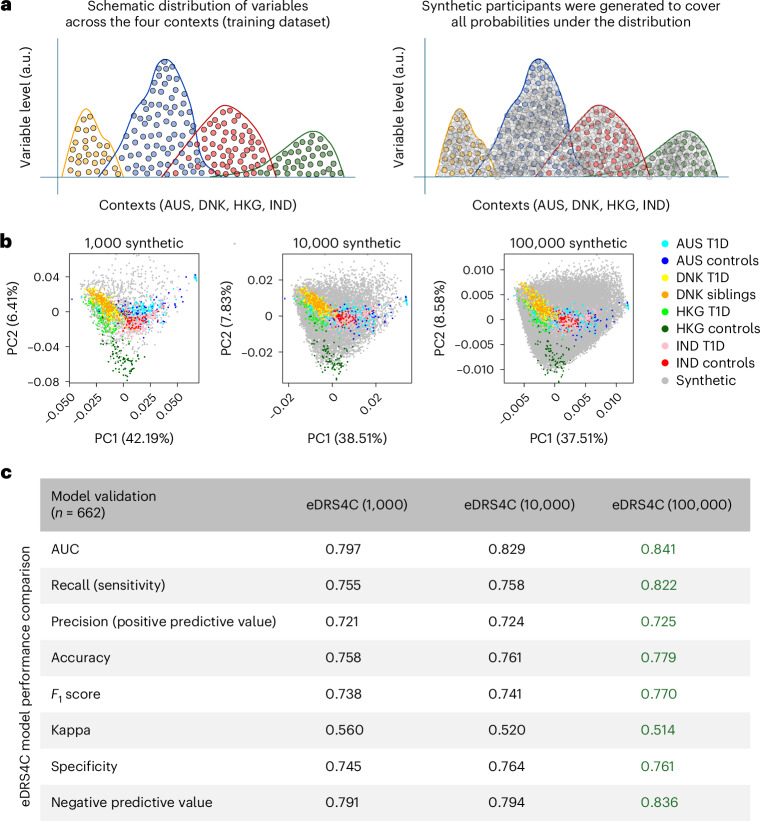
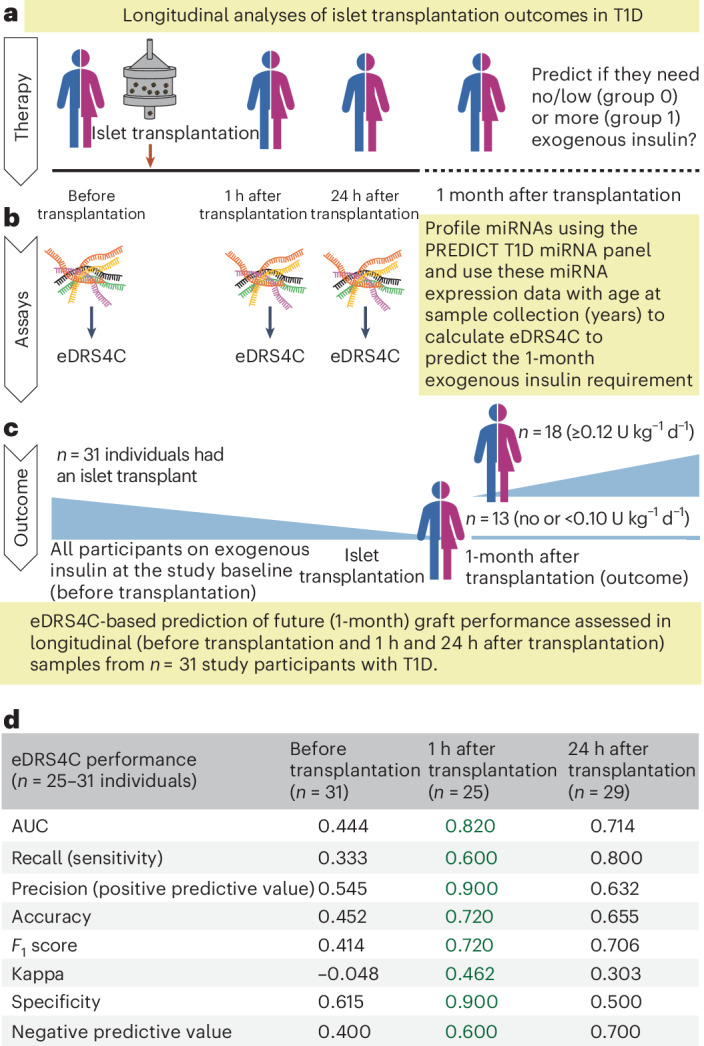
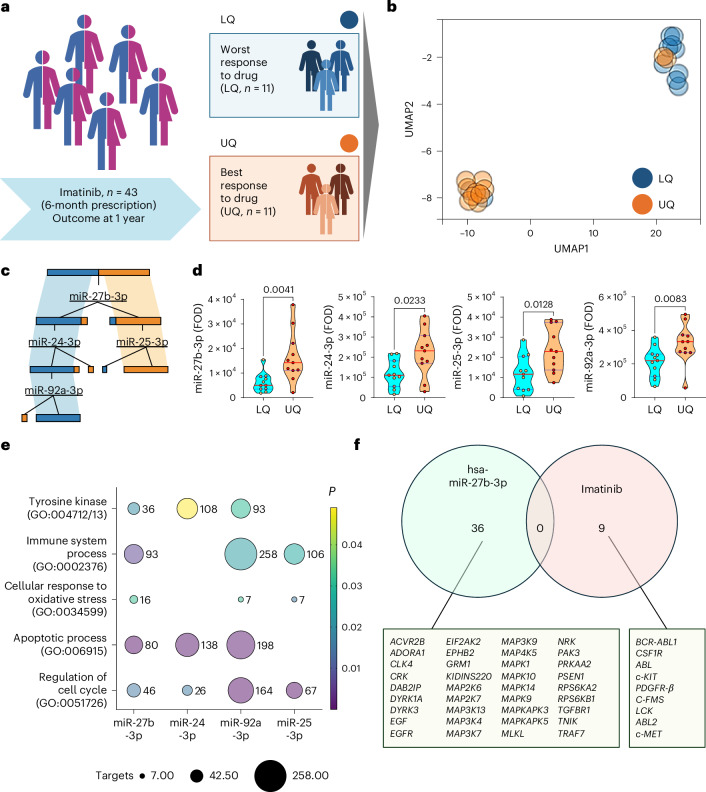
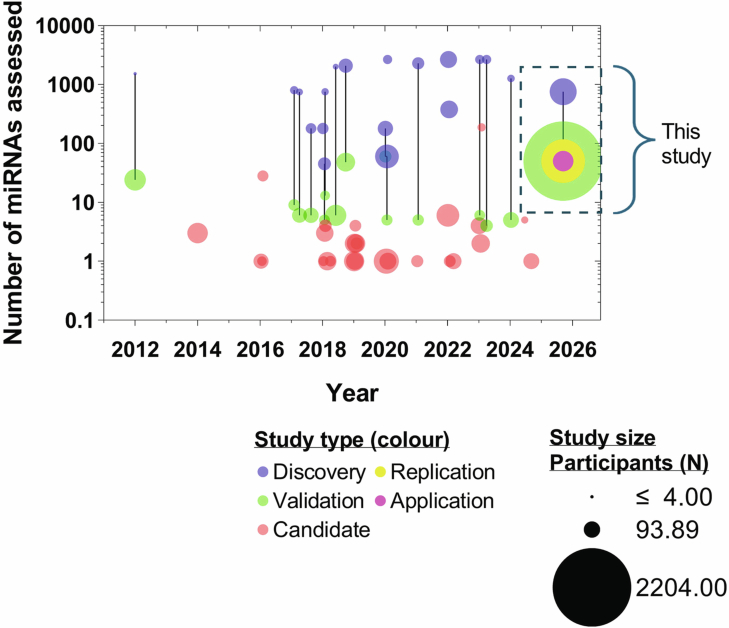
Identifying individuals at high risk of type 1 diabetes (T1D) is crucial as disease-delaying medications are available. Here we report a microRNA (miRNA)-based dynamic (responsive to the environment) risk score developed using multicenter, multiethnic and multicountry ('multicontext') cohorts for T1D risk stratification. Discovery (wet and dry lab) analysis identified 50 miRNAs associated with functional β cell loss, which is a hallmark of T1D. These miRNAs measured across n = 2,204 individuals from four contexts (4C: Australia, Denmark, Hong Kong SAR People's Republic of China, India) led to a four-context, miRNA-based dynamic risk score (DRS) that effectively stratified individuals with and without T1D. Generative artificial intelligence was used to create an enhanced four-context, miRNA-based DRS, which offered good predictive power (area under the curve = 0.84) for T1D stratification in a separate multicontext validation dataset (n = 662), and accurately predicted future exogenous insulin requirement at 1 hour of islet transplantation. In a clinical trial assessing the imatinib drug therapy, baseline miRNA signature, rather than clinical characteristics, distinguished drug responders from nonresponders at 1 year. This study harnessed machine learning/generative artificial intelligence approaches, identifying and validating a miRNA-based DRS for T1D discrimination and treatment efficacy prediction.


Conflict of interest statement

Competing interests: S.E.G. has served on advisory boards for Abata, Genentech, GentiBio, Provention Bio, SAB Biotherapeutics, Sanofi and Shoreline Biosciences. He has received support from Provention Bio, Sanofi and the National Institutes of Health for his roles in conducting clinical trials. He serves on data and safety monitoring boards for Diamyd Medical, Breakthrough T1D and INNODIA. F.P. has received advisory and lecture fees from Sanofi Aventis. A.A.H. has served on the advisory boards of Abbott and Mylan, and has received grants through Breakthrough T1D and the Novo Nordisk Foundation to identify the biomarkers and regulators of diabetes progression. He has been funded through The Leona M. and Harry B. Helmsley Charitable Trust to develop a nanotechnology-based method for miRNA detection. The other authors declare no competing interests.

Figures

Fig. 1
Fig. 1. Study design and identification of a signature of 50 PREDICT T1D miRNAs through a discovery and data-driven approach using published datasets.
a, Schematic flow chart of the four elements of this study (shown using block arrows at the top), details of the discovery cohorts, DRS generation and validation datasets, and their application in T1D therapy datasets. GAI-aided eDRS4C methods are detailed in the text. b, Significant miRNAs identified through our wet lab discovery analyses across n = 254 human samples (including plasma from n = 5 controls and n = 5 participants with newly diagnosed T1D) are shown at the top. Additionally, miRNAs from the literature that were reported to be significant but not reaching significance in our wet lab discovery analyses were also included in this PREDICT T1D miRNA panel. Details of miRNA spike-in controls, internal and positive controls, and negative controls are also provided. The Sankey plot shows the miRNA categories based on our discovery analyses (top) and all published reports (Supplementary Table 1) wherein these miRNAs have been associated with HLA, autoantibody, early diagnosis or T1D versus control (indicated by the filled blue circles), emphasizing the reason for these miRNAs to be included in the panel.
Fig. 2
Fig. 2. Development and evaluation of a miRNA-based DRS.
a, Details of the study samples, their T1D status across the four contexts and the number of samples randomized for a training dataset (to generate the DRS4C model) and a testing dataset (to assess the performance of this model). b, ROC curve demonstrating the performance of DRS4C on the multicontext testing dataset (n = 661). The dashed black diagonal line is the discriminatory line; the solid blue and green lines show the ROC for class 0 (control) and 1 (T1D), respectively, while the dashed green lines represent the micro-average and macro-average ROCs (0.78–0.81). c, The key performance measures for DRS4C. d, A SHAP value beeswarm plot indicating the most important variables contributing to the performance of the DRS4C. Each point on the plot represents the SHAP value for study participants, with the position along the x axis representing the magnitude of the SHAP value and the color representing the weight for the feature value.
Fig. 3
Fig. 3. Leveraging GAI to create an eDRS4C and validation on an independent case-control dataset.
a, Rationale for using GAI. Left, A theoretical distribution of a single variable across individuals from four contexts is shown. GAI allows the creation of synthetic samples that can maximize all probabilities of variable expression (gray filled plots on the right), while preserving the original data distribution. b, We used the Gaussian copula Synthetic Data Vault (SDV) workflow to create 1,000, 10,000 or 100,000 synthetic control samples. The principal component analysis (PCA) plots present the distribution of real (control and T1D) and synthetic (gray) datasets. These augmented (real + synthetic) datasets containing 1,000, 10,000 or 100,000 synthetic samples were used to develop the eDRS4C model. c, Performance characteristics of the eDRS4C models developed from the augmented datasets containing 1,000, 10,000 and 100,000 synthetic samples on 662 samples (controls n = 364 and T1D n = 298) in an independent validation cohort. a.u., arbitrary unit.
Fig. 4
Fig. 4. Application of the eDRS4C in predicting future diabetes status in islet cell therapy for T1D.
a, A cohort of Canadian (CAN) participants, who had their plasma samples before transplantation and 1 h and 24 h after transplantation available for the biomarker analyses, was included. b, The eDRS4C model based on 100,000 synthetic data (Fig. 3) was assessed before transplantation, and 1 h and 24 h after transplantation, and used to predict diabetes status (insulin dependence versus no or low insulin requirement). c, Of the n = 31 participants, n = 18 were on exogenous insulin (≥0.12 U kg−1 d−1) and n = 13 were on no or low exogenous insulin (<0.10 U kg−1 d−1) 1 month after transplantation. d, The performance characteristics of the eDRS4C model are provided to compare the changes in prediction during the 24 h after transplantation.
Fig. 5
Fig. 5. Assessment of eDRS4C (PREDICT T1D) miRNAs in predicting drug responsiveness at the study baseline in the imatinib T1D trial.
a, PREDICT T1D miRNAs were profiled in the imatinib study participants from the drug intervention arm at the study baseline. Individuals were stratified to the UQ and LQ of response to therapy (C-peptide levels assessed at 1 year). b, The UMAP dimensionality reduction algorithm was applied to the expression profile of all 50 miRNAs across UQ and LQ study participants, leading to two broad clusters representing drug response at 1 year. c, Decision tree for key variables from our eDRS4C that aid in the segregation of UQ and LQ responders to imatinib therapy. d, The expression of the top four miRNAs in the decision tree was assessed between UQ and LQ participants using a one-sided Welch’s t-test. e, Key pathways along with their Gene Ontology (GO) IDs (y axis), which are targeted by the top four miRNAs (x axis) in the decision tree, are shown using a bubble plot. The size of the bubble indicates the number of target genes (written next to each bubble), while the color of the bubble denotes the significance of the miRNA target pathway interaction as obtained using the miRPathDB tool. A color scale for the adjusted P value is also provided. A hypergeometric test with Benjamini–Hochberg adjustment was used for the enrichment analyses on miRPathDB. f, Venn diagram presenting 36 genes in the tyrosine kinase pathway that are targeted by hsa-miR-27b-3p (GO:0004712) and nine genes involved in the tyrosine kinase pathway inhibited by imatinib.
Extended Data Fig. 1
Extended Data Fig. 1. PREDICT T1D microRNA profiling following in vitro human islet cell death.
Freshly isolated human islet preparations (n = 6, identified by the site and/donor ID) were exposed to different concentrations (0 mM, 1 mM, 10 mM) of a nitric oxide (NO)-donor (sodium nitroprusside; SNP). Bidirectional hierarchical clustering identified increased levels of PREDICT T1D microRNAs in supernatant with increasing concentrations of sodium nitroprusside. Data are presented as normalised Ct (cycle threshold) values, as described in methods, and represent microRNA abundance as measured by TaqMan qRT-PCR. A red colour denotes higher abundance (lower Ct-value) of microRNA in the supernatant, while white colour indicates no detectable expression (Ct-value > 39). Replicates from different experiments for the same donor are identified by the same donor ID.
Extended Data Fig. 2
Extended Data Fig. 2. Context-wise expression of PREDICT T1D microRNAs.
Relative expression of the 50 PREDICT T1D microRNAs in the circulation of study participants from four contexts (AUS, HKG, IND, DNK). AUS Control n = 209, T1D n = 519; HKG Control n = 118, T1D n = 120; IND Control n = 133, T1D n = 497; DNK siblings of individuals with T1D n = 292, T1D n = 316. Further details of study participants are provided in Supplementary Table 2. The Y-axis presents microRNA transcript abundance (fold-over-detectable) with data for each of the four contexts and all four contexts together (“All Four”) on the X-axis. Each dot in the scatter plot denotes the microRNA expression level for a single individual, with a green colour for Control samples, while a dark red colour for individuals with T1D. For DNK, siblings of individuals with T1D are presented with a lighter red colour. Data presents the geometric mean with 95% CI (solid lines). Significance is calculated using Kruskal-Wallis test with uncorrected Dunn’s multiple comparison. NS= not significant; *=p < 0.05; **=p < 0.01; ***=p < 0.001, ****=p < 0.0001.
Extended Data Fig. 3
Extended Data Fig. 3. Genomic location and collinearity of PREDICT T1D microRNAs across four contexts.
Circos plot providing the relative genomic location for each of the PREDICT T1D microRNAs. Links connecting different microRNAs represent their collinearity (two- sided spearman correlation coefficient >0.9 and p < 0.05) within the four contexts (AUS n = 728, DNK n = 608, HKG n = 238, IND n = 630), each presented with a different colour as indicated below the plot.
Extended Data Fig. 4
Extended Data Fig. 4. Association between PREDICT T1D microRNAs and autoantibody expression.
A sub-analysis was carried out to assess correlation between autoantibody levels (IA2A, GADA, ZnT8R and ZnT8W) and PREDICT T1D microRNA abundance for participants from DNK, wherein autoantibody measurements for a subset of siblings and cases (T1D) were available. All statistically significant two-sided spearman correlations (P < 0.05) are indicated with a red (positive correlation) or blue (negative correlation) fill colour; a white fill represents no significant correlation. The correlation coefficient is presented within the correlation matrix as per the colour shade legend (right). Data represent siblings (n = 168) who had a first-degree relative (parent and/or sibling) with T1D and n = 96 individuals who were clinically diagnosed with T1D.
Extended Data Fig. 5
Extended Data Fig. 5. Associations between age at onset, age at sampling and/or diabetes duration with PREDICT T1D microRNAs.
A sub-analysis was carried out to assess the correlation between age at sampling, age at onset, diabetes duration and the PREDICT T1D microRNA abundance for a subset of the T1D study participants from DNK (n = 237) and HKG (n = 101). All statistically significant two-sided spearman correlations (P < 0.05) are indicated with a red (positive correlation) or blue (negative correlation) fill colour; a white fill represents no significant correlation. The correlation coefficient is presented within the correlation matrix as per the colour shade legend (right).
Extended Data Fig. 6
Extended Data Fig. 6. The relative importance of PREDICT T1D microRNAs across four contexts.
The relative importance of all PREDICT T1D microRNAs and age at sample collection is presented as percent contribution for each of the four contexts: Australia (Red), Denmark (Blue), Hong Kong (Yellow) and India (Green). Mean Decrease Gini (MDG) index was estimated through random forest ML-based algorithm to rank the variables by their relative importance.
Extended Data Fig. 7
Extended Data Fig. 7. Capacity of pre- transplant (pre-Tx) baseline clinical and/or biochemical parameters in discriminating participant’s responsiveness to therapy.
(a-h) Comparison of available baseline clinical/biochemical features to assess their capacity to discriminate study participants into two treatment response groups – those that showed no/low (0– 0.10U/Kg/day, n = 8, (panel h), 10 (panel c, e, f), 12 (panel g) or 13 (panel a, b, d) study participants) exogenous insulin requirement at 1-month post-Tx (blue) vs those that required higher (>0.12U/Kg/day, n = 10 (panel h), 15 (panel c, e, f), 16 (panel b) or 18 (panel a, d, g) individuals) exogenous insulin at 1-month post-Tx (orange). The number of participants in each comparison varied based on data availability. Statistical significance is presented based on two-sided t-test between the two groups. Data presents the minimum, 25th percentile, median, 75th percentile and maximum values in the box and whiskers graphs. (i) A dimensionality reduction algorithm was used to see if all clinical variables together offered reliable stratification of the no/low (n = 6) vs high exogenous insulin requirement (n = 9).
Extended Data Fig. 8
Extended Data Fig. 8. Capacity of baseline variables in discriminating participant’s responsiveness to imatinib therapy.
(a-h) Comparison of available baseline clinical/biochemical features to assess their potential in stratifying clinical trial participants to two treatment response groups – those that were in the Lower Quartile (LQ) of drug response (blue, n = 11/group, panel d with n = 10) vs those in the Upper Quartile (UQ) of the drug response (orange, n = 11). Statistical significance is presented based on two-sided Welch’s t-test between the two groups. Data presents the minimum, 25th percentile, median, 75th percentile and maximum values in the box and whiskers graphs. (i) A dimensionality reduction algorithm was used to see if all available baseline clinical variables together could stratify the LQ (n = 11) and UQ (n = 11) participants. DV=dependant variables. (j) The expression of 17 of the PREDICT T1D microRNAs (indicated on the Y-axis) was significantly different across the UQ (n = 11) and LQ (n = 11) of imatinib clinical trial participants. All microRNAs (most targeting tyrosine kinase) were significantly higher in participants who best responded to imatinib therapy. Statistical significance across the two groups is presented for each microRNA comparison based on a one-sided Welch’s t-test. Data presents the median (red solid line), quartiles (blue dotted line) and distribution in the violin plots.
Extended Data Fig. 9
Extended Data Fig. 9. Usability of the eDRS4C risk score in different scenarios.
Plasma of a single individual was assessed for the PREDICT T1D microRNAs and autoantibodies from 14 months of age to 60 months of age (Clinical diagnosis of T1D). a) shows the PREDICT T1D microRNA-based eDRS4C at different timepoints during progression to T1D. The eDRS4C was already high (>60% T1D probability) at the first measurement (14 months), increasing to >75% T1D probability at 18 months of age, and remaining high (>60% probability) thereafter. Islet autoantibodies (b) increased in circulation at later time points (from week 39 onwards). Similarly, the PREDICT T1D microRNAs can be used in an anomaly detection algorithm to identify individuals within a cohort (first-degree T1D relatives from DNK) who could be further risk-stratified to T1D progressors and non-progressors. c) An isolation forest (anomaly detection) plot using existing biomarkers of T1D risk (GRS, autoantibodies and age), T1D progressors (n = 4), and non-progressor (n = 159) d) An isolation forest (anomaly detection) plot using the top 10 features (see Fig. 2d) of this microRNA-based T1D risk score. The red dots indicate siblings predicted to be at the highest risk of progression to T1D, while the blue dots represent those at lower risk of T1D. Four of these individuals (S1137, S1213, S1338, S3210) within this cohort progressed to T1D in 12 years from sample collection (T1D progressors n = 4, and non-progressors n = 288). Those labelled in a red-coloured font are correctly identified as progressors using the existing (GRS, autoantibodies, and age; c) or the top-10 features of the microRNA-based (d) risk scores.
Extended Data Fig. 10
Extended Data Fig. 10. A comparison of existing studies evaluating plasma/serum microRNAs in T1D.
A comparison of studies that assessed the expression of microRNAs in plasma/serum from healthy controls and individuals with type 1 diabetes. The red bubbles indicate candidate microRNA studies, whilst the Discovery- Validation study designs are marked with blue and green bubbles respectively, with a connecting line indicating validation of specific (discovery) miRNAs within that study. The X-axis indicates the year of publication, the Y- axis indicates the number of microRNAs assessed in the study, the size of the bubble represents the number of study participants, while the colour of the bubble indicates the study type (Candidate, Discovery, Validation, Replication, Application). The microRNAs measured and presented in this study are placed on the rightmost end (based on this preprint’s submission date for 2025). Studies included in this bubble plot are listed in Supplementary Table 8.

References

    1. Mathis, D., Vence, L. & Benoist, C. β-Cell death during progression to diabetes. Nature414, 792–798 (2001). - PubMed
    1. Borchers, A. T., Uibo, R. & Gershwin, M. E. The geoepidemiology of type 1 diabetes. Autoimmun. Rev.9, A355–A365 (2010). - PubMed
    1. Atkinson, M. A. & Gianani, R. The pancreas in human type 1 diabetes: providing new answers to age-old questions. Curr. Opin. Endocrinol. Diabetes Obes.16, 279–285 (2009). - PubMed
    1. Ziegler, A. G. et al. Seroconversion to multiple islet autoantibodies and risk of progression to diabetes in children. JAMA309, 2473–2479 (2013). - PMC - PubMed
    1. Barker, J. M. et al. Two single nucleotide polymorphisms identify the highest-risk diabetes HLA genotype: potential for rapid screening. Diabetes57, 3152–3155 (2008). - PMC - PubMed

Publication types

MeSH terms