. 2025 Jun 5;8(1):174.
doi: 10.1038/s42004-025-01573-4.

Molecular dynamics guided identification of a brighter variant of superfolder Green Fluorescent Protein with increased photobleaching resistance

Affiliations

Molecular dynamics guided identification of a brighter variant of superfolder Green Fluorescent Protein with increased photobleaching resistance

Rochelle D Ahmed et al. Commun Chem. .

Abstract

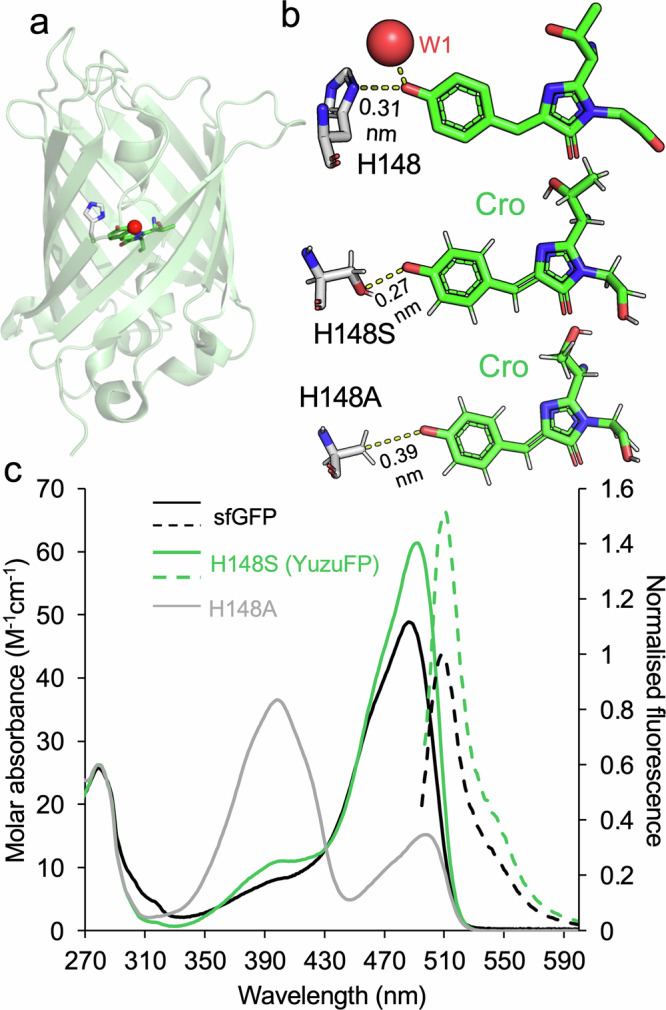
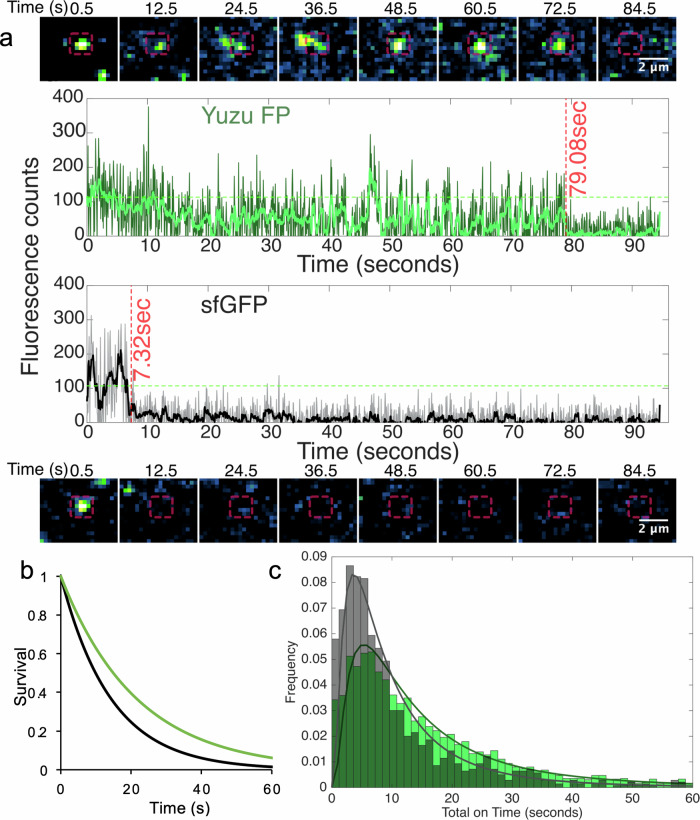
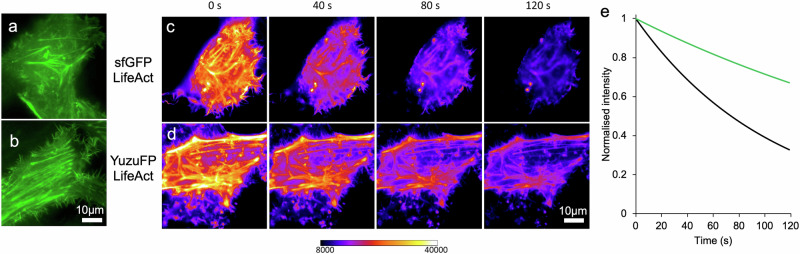
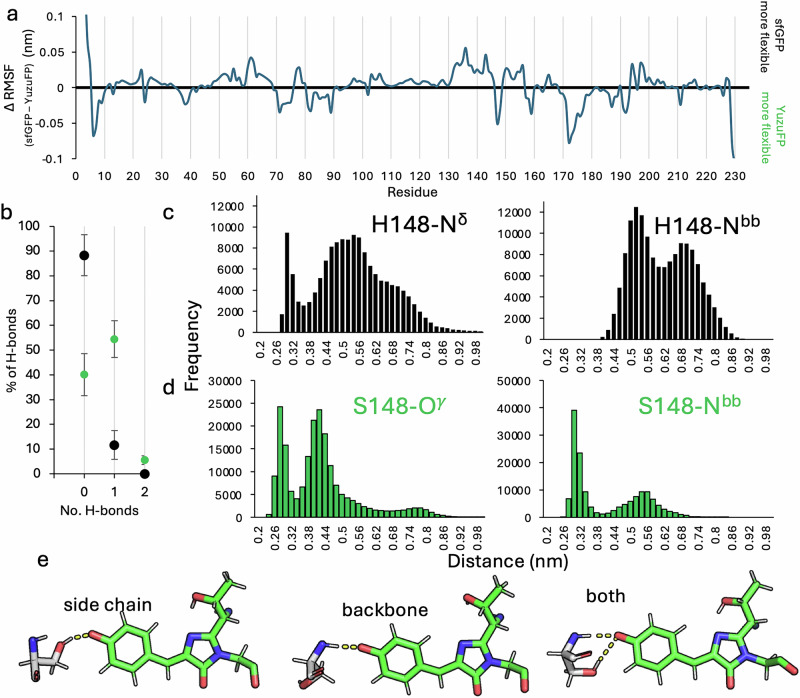
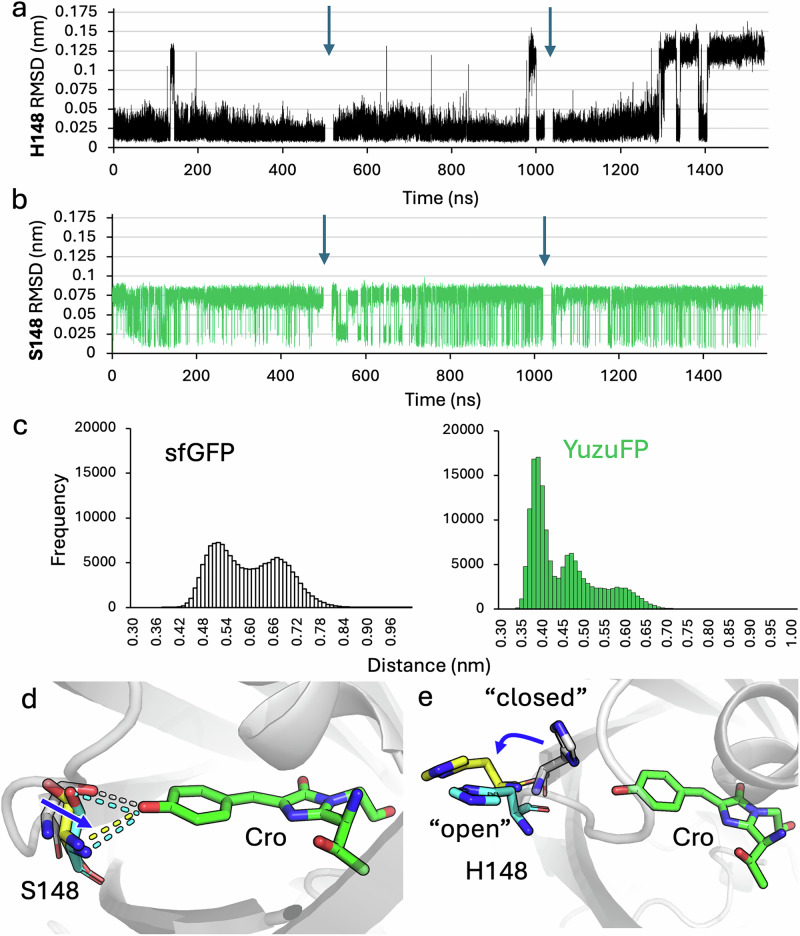
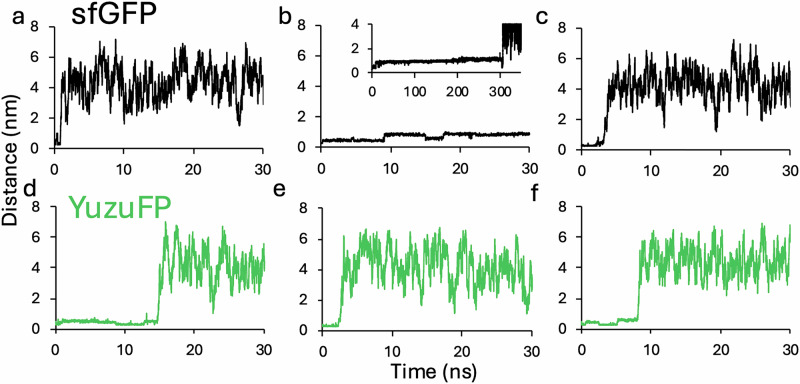
Fluorescent proteins (FPs) are a crucial tool for cell imaging, but with developments in fluorescence microscopy and researcher requirements there is still a need to develop brighter versions that remain fluorescent for longer. Using short time-scale molecular dynamics-based modelling to predict changes in local chromophore interaction networks and solvation, we constructed an Aequorea victoria GFP (avGFP) variant called YuzuFP that is 1.5 times brighter than the starting superfolding variant (sfGFP) with a near 3-fold increased resistance to photobleaching in situ. YuzuFP contained a single mutation that replaces the chromophore interacting residue H148 with a serine. Longer time scale molecular dynamics revealed the likely mechanism of action: S148 forms more persistent H-bond with the chromophore phenolate group and increases the residency time of an important water molecule. As demonstrated by live cell imaging, YuzuFP not only offers a timely upgrade as a useful green-yellow avGFP for cell imaging applications over longer time scales, but it also provides a basic scaffold for future avGFP engineering efforts.


Conflict of interest statement

Competing interests: The authors declare no competing interesting.

Figures

Fig. 1
Fig. 1. Engineering the interactions between residue 148 and the chromophore in sfGFP.
a Overall crystal structure of sfGFP (PDB 2b3p) 14 with the arrangement of the chromophore (green sticks) relative to H148 (grey sticks) shown. b Comparison of the H148 interaction from the crystal structure of sfGFP and the short time scale molecular dynamics models of the H148S and H148A variants. Dashed yellow lines represent distances between Cro phenolate O and nearby heavy atoms. Other H148X models can be found in Supplementary Fig. 3. c Spectral characteristics of sfGFP (black), our newly designed H148S (also known as YuzuFP) (green) and H148A (grey). Solid lines represent absorbance spectra and dashed line emission spectra. Emission spectra for sfGFP and YuzuFP were recorded on excitation at 485 nm and 492 nm, respectively. Emission spectra were normalised to the sfGFP emission maximum. Source data for plots in (c) are provided in Supplementary Data 1.
Fig. 2
Fig. 2. Single molecule fluorescence characteristics of sfGFP and YuzuFP.
a Example single FP fluorescence images at various timepoints and their corresponding emission traces for YuzuFP (top, green) and sfGFP (bottom, black). In the image time course, the red box denotes the region of interest representing the analysed area. Dark green and grey traces show the raw data for each protein while the lighter green and black lines show the denoised data after applying a Chung-Kennedy filter. The green dashed line in each instance represents the threshold separating values considered on and off. More traces can be found in Supplementary Fig. 7. b Single molecule photobleaching survival plot for YuzuFP (green) and sfGFP (black) based on proportion of FPs retaining fluorescence (survival) over time. The decay curves were generated by fitting a single component exponential function to empirical cumulative distribution functions comprised of lifetimes from 3766 and 1283 individual FP traces for Yuzu FP and sfGFP, respectively. c Frequency distribution of total “on” times for YuzuFP (green) and sfGFP (grey), representing the cumulative time molecules across each population spent in an “on” bright state prior to photobleaching. The data was binned at 1.2 s intervals. The solid lines represent a log-normal fit to the distribution. Source data for plots in (ac) are provided in Supplementary Data 1.
Fig. 3
Fig. 3. Live cell imaging of YuzuFP and sfGFP LifeAct Fusions.
Wide-field image of a sfGFP and b YuzuFP LifeAct fusions. Time course of c sfGFP and d YuzuFP LifeAct fusions false coloured using a 16 bit Fire look-up table with the black value set to 8000, and the white value set to 40,000, to visualise signal within the dynamic range of the microscope setup. Note the similar intensities following 40 s constant exposure of sfGFP, to the 120 s timepoint of YuzuFP. e In situ photobleaching of YuzuFP (green line) and sfGFP (black line). Six independent intensity values were normalised to 1.0 (based on the intensity at 0 s), background subtracted and fit to a one phase decay curve in GraphPad Prism. Source data for plots in (e) are provided in Supplementary Data 1.
Fig. 4
Fig. 4. Hydrogen bonding between the chromophore and residue 148.
a Per residue Cα root mean square fluctuation (RMSF) difference plot. The difference plot was generated by subtracting the Cα RMSF values of YuzuFP from that of sfGFP. The individual RMSF plots are shown in Supplementary Fig. 8a. Positive values indicate that sfGFP is more flexible and negative values that YuzuFP is more flexible. b The percentage of time H-bonds are formed between Cro and residue 148 over the course of the MD simulations for sfGFP (black) and YuzuFP (green). Error bars are the standard deviation between values measured for the 3 individual simulations. The pair-wise distance distribution in c sfGFP and d YuzuFP, between chromophore phenolate oxygen and residue 148 backbone and side chain H-bond donor heavy atoms across all simulation data. Bin sizes are 0.02 nm. The distance against time plot is shown in Supplementary Fig. 9. e Representative individual trajectories illustrating the H-bond between the S148 side chain hydroxyl group (simulation 2, 297.80 ns), backbone amine group (simulation 2, 254.39 ns) or both in YuzuFP (simulation 2, 5.43 ns). H-bonds are shown as orange dashes. Source data for plots in (ad) are provided in Supplementary Data 1.
Fig. 5
Fig. 5. Conformational changes to residue 148.
The root mean square deviation (RMSD) of a H148 in sfGFP and b S148 in YuzuFP. c The distance distribution between the Cro phenolate oxygen and the Cα of residue 148 for all simulations. The bin size is 0.01 nm. The distance change over time plot for each simulation is shown in Supplementary Fig. 10. d Representative trajectories of YuzuFP (grey, 0 ns; yellow, simulation 1, 150.75 ns, RMSD 0.09 nm; cyan, simulation 1, 168.74 ns, RMSD 0.08 nm). The dashed lines represent polar contacts as determined using PyMOL. e Representative trajectories of sfGFP (grey, 0 ns; yellow simulation 3, 262.86 ns, RMSD 0.12 nm; cyan, simulation 3, 250.87 ns RMSD 0.12 nm). The blue arrow indicates the direction of backbone movement with respect to the starting trajectory (0 ns). Source data for plots in (ac) are provided in Supplementary Data 1.
Fig. 6
Fig. 6. Residency of the structurally the conserved water molecule, W1, close to the chromophore phenolate oxygen.
Distance between the chromophore phenolate oxygen and the O atom of the water molecule W1 (see Fig. 1a for reference) in (ac) sfGFP and (d, e) YuzuFP in each of the 500 ns simulations. In (b), shown inset is the distance over an extended period (350 ns). Source data for plots in (af) are provided in Supplementary Data 1.

Similar articles

References

    1. Shaner, N. C., Steinbach, P. A. & Tsien, R. Y. A guide to choosing fluorescent proteins. Nat. Methods2, 905–909 (2005). - PubMed
    1. Zimmer, M. Green fluorescent protein (GFP): applications, structure, and related photophysical behavior. Chem. Rev.102, 759–781 (2002). - PubMed
    1. Rodriguez, E. A. et al. The growing and glowing toolbox of fluorescent and photoactive proteins. Trends Biochem. Sci.42, 111–129 (2017). - PMC - PubMed
    1. Day, R. N. & Davidson, M. W. The fluorescent protein palette: tools for cellular imaging. Chem. Soc. Rev.38, 2887–2921 (2009). - PMC - PubMed
    1. Duwé, S. & Dedecker, P. Optimizing the fluorescent protein toolbox and its use. Curr. Opin. Biotechnol.58, 183–191 (2019). - PubMed

LinkOut - more resources