. 2025 Jun;57(6):1512-1523.
doi: 10.1038/s41588-025-02193-3. Epub 2025 Jun 5.

High-definition spatial transcriptomic profiling of immune cell populations in colorectal cancer

Collaborators, Affiliations

High-definition spatial transcriptomic profiling of immune cell populations in colorectal cancer

Michelli Faria de Oliveira et al. Nat Genet. 2025 Jun.

Abstract

A comprehensive understanding of cellular behavior and response to the tumor microenvironment (TME) in colorectal cancer (CRC) remains elusive. Here, we introduce the high-definition Visium spatial transcriptomic technology (Visium HD) and investigate formalin-fixed paraffin-embedded human CRC samples (n = 5). We demonstrate the high sensitivity, single-cell-scale resolution and spatial accuracy of Visium HD, generating a highly refined whole-transcriptome spatial profile of CRC samples. We identify transcriptomically distinct macrophage subpopulations in different spatial niches with potential pro-tumor and anti-tumor functions via interactions with tumor and T cells. In situ gene expression analysis validates our findings and localizes a clonally expanded T cell population close to macrophages with anti-tumor features. Our study demonstrates the power of high-resolution spatial technologies to understand cellular interactions in the TME and paves the way for larger studies that will unravel mechanisms and biomarkers of CRC biology, improving diagnosis and disease management strategies.


Conflict of interest statement

Competing interests: All authors are current or former employees or shareholders of 10x Genomics.

Figures
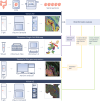
Fig. 1
Fig. 1. Analysis of CRC and NAT samples using Visium HD.
Serial tissue sections were taken from colorectal adenocarcinoma (CRC, n = 5 samples) and NAT (n = 3 samples) FFPE blocks. A subset of samples were selected and analyzed with the Visium HD assay (n = 3 CRC and n = 2 NAT samples). Sections from the same FFPE blocks were assayed with scRNA-seq (Chromium Single Cell Gene Expression Flex; n = 8). Serial sections were analyzed with Xenium In Situ Gene Expression (n = 4 CRC samples) and assayed via the Visium v2 assay (n = 1 CRC and n = 2 NAT samples). Single-cell data were used to create a reference dataset for cell type annotation. In situ data were used for validation of the findings from the Visium HD data and for subsequent analyses. Technology performance comparisons were made using data from matched datasets.
Fig. 2
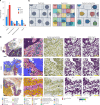
Fig. 2. Visium HD Spatial Gene Expression slide architecture and performance.
a, Visium HD slide with two 6.5 × 6.5-mm capture areas, each containing a continuous lawn of uniquely barcoded 2 × 2-µm squares, which are binned to 8-µm squares for downstream analysis. Oligo, oligonucleotide; Read 1T, TruSeq Read 1; Poly(dT)VN, a string of T nucleotides followed by a variable nucleotide V (A, C or G) and then another variable nucleotide N (A, C, G or T). b, Visium HD slides, compared with Visium v2 slides, which have spots of 55 µm in diameter spaced 100 µm apart. c, Comparison of serial sections of a representative normal colon mucosa sample, P3NAT (one replicate). Visium HD detects 18 clusters that closely correspond to tissue morphology, while Visium v2 detects three clusters. H&E, hematoxylin and eosin. d, Sensitivity comparison between Visium HD and Visium v2 on the representative sample P3NAT. The left plot shows expression levels of all probes (whole transcriptome); the right plot shows only probes spanning an exon–exon splice junction. Diagonal lines represent x = y. e, Transcript localization accuracy analysis performed across four randomly selected ROIs per tissue section (three independent samples, one replicate per sample) for selected goblet cell gene markers (CLCA1, FCGBP and MUC2); source masks are colon gland structures, and adjacent masks are the immediately adjacent regions containing lamina propria. Images show selected ROIs in a representative normal sample, P3NAT (one replicate); red lines outline the source mask, and yellow lines outline the adjacent mask. Table shows the median percentage of localized transcripts in the source and adjacent masks, the density of selected transcripts in both masks and the distance of selected transcripts from source masks (*). Four ROIs in each colon sample were included in this analysis. Source data
Fig. 3
Fig. 3. Spatial mapping of CRC samples using Visium HD reveals high-resolution, accurate transcript mapping.
a, Spatial mapping of three CRC samples (P1CRC, P2CRC and P5CRC) with 8-µm bins colored based on unsupervised clustering labels (level 2 labels) via sketch analysis. b, Spatial mapping of the same three CRC samples with 8-µm bins colored by cell types predicted by deconvolution using the single-cell reference dataset. cDC, conventional dendritic cell; mRegDC, mature dendritic cell enriched in immunoregulatory molecules; NK, natural killer cell; pDC, plasmacytoid dendritic cell; SM, smooth muscle; vSM, vascular smooth muscle. c, Corroboration of selected cellular gene markers with known spatial localization: PIGR (goblet cells and enterocytes), CEACAM6 (tumor) and COL1A1 (fibroblasts). Samples correspond to those in a. For each sample, the tissue-level view is shown on the left, with the inset as a black box, and the inset view is shown on the right. Scale bars, 1 mm (yellow or black), 80 µm (blue).
Fig. 4
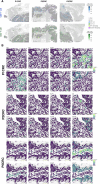
Fig. 4. Cellular composition of the tumor periphery in each CRC section.
a, Analysis of the tumor periphery. Bins (8 μm) annotated as tumor cells are shown in red, with bins within 50 µm of the tumor periphery shown in blue. Rows correspond to three different samples. The first column shows the 6.5 × 6.5-mm capture area, the second column shows the magnified view, the third column shows the corresponding expression of C1QC (macrophages), and the fourth column shows the corresponding expression of COL1A1 (fibroblasts). b, Dot plot with the proportion of cell types in the tumor periphery (blue) and the rest of the tissue section (gray) for the three different blocks. c, Dot plot showing expression profiles of two distinct macrophage subpopulations identified at the boundary in the tumor samples studied. Dots are shown if a gene is expressed in at least 20% of the cells of a given group. d, Kernel density maps showing the differential spatial localization of SELENOP+ and SPP1+ macrophages and how they are associated with tumor areas. Scale bars, 1 mm (black), 125 µm (green). Source data
Fig. 5
Fig. 5. Identification and localization of two macrophage subpopulations in the TME.
a, Bar plot showing the enriched gene sets for the macrophage subpopulations identified. The length of the bar represents the −log10 (adjusted P value) from one-tailed Fisher’s test. P values were corrected for multiple-hypothesis testing using the Benjamini–Hochberg method. Adj., adjusted; IL, interleukin; mTORC1, mechanistic target of rapamycin complex 1; STAT5, signal transducer and activator of transcription 5; UV, ultraviolet. b, Violin plots representing the expression of top genes in the tumor regions near SPP1+ (top) and SELENOP+ (bottom) macrophages. c, Dot plot showing expression profiles of goblet cell subpopulations identified via unsupervised clustering. d, Spatial plots showing the localization of the identified goblet cell subpopulations. e, Interaction networks of macrophages, T cells and tumor cells in the boundary regions (50 µm). Nodes represent cell types, and edges represent the number of significant ligand–receptor (LR) pairs. f, Dot plot representing the expression and specificity of ligand–receptor pairs for SPP1+ and SELENOP+ macrophages as sources. Scale bars, 1 mm. Source data
Fig. 6
Fig. 6. Spatial localization of T cells in the TME.
a, Bar plot showing the proportion of each 8-µm bin class (singlet, doublet, rejected) for each tissue region for each patient (n = 3). Error bars represent mean values ± s.d. b, Schematic representation of the two approaches for binning the 2 × 2-µm barcoded squares in Visium HD data. The capture area of a Visium HD slide is a continuous grid of barcodes (left). The Space Ranger pipeline by default will create square bins (shown here as 8 × 8-µm squares of a single color) that tile the entire tissue-containing capture area (middle). This is the cell assignment method used for the 8 × 8-µm binned data. An alternative is to use the nuclear stain from a high-resolution H&E microscope image to group together barcodes that underlie the same cell nuclei based on the 2 × 2-µm data (right). c, Spatial plots showing a magnified view of regions with bins labeled by deconvolution results at 8 µm (left), nuclear segmentation results in the magnified regions (center) and normalized expression of CD4 and CD8A (right) of the transformed UMI matrix by grouping 2 × 2-µm bins within each of the segmented nuclei. Scale bars, 1 mm (black), 50 µm (yellow). Source data
Fig. 7
Fig. 7. Xenium In Situ confirms the existence and localization of macrophage subtypes and clonally expanded T cells in the TME.
a,b, Expression of REG1A and TGFBI transcripts (right) and SPP1 (bottom left) within the tumor region (top left). Max, maximum; min, minimum. c, STAB1+ macrophages near REG1A+ and LCN2+ tumor cells. d, STAB1+ macrophages near LCN2+ tumor cells and REG1A+ and LCN2+ goblet cells. STAB1 was used to visualize the macrophage subtype coexpressing SELENOP. e,f, SPP1+ macrophages shown in proximity of TGFBI+ and PERP+ tumor cells and MMP11+ CAFs. g, Combined expression of the clonotype TRA1/TRA2/TRB in sample P5CRC. TRA1, TRAV38-1–TRAJ58; TRA2, TRAB38-2/DV8-TRAJ57; TRB, TRBV4-2–TRBJ2-1. h, Clonally expanded CD8+ T cells reside close to tumor cells and within CXCL9-, CXCL10- and CXCL11-expressing foci. i, Magnified view of the same regions using Visium HD with 2-µm bins assigned to segmented nuclei. Bins are colored by the normalized log (UMI) counts of CEACAM5, SELENOP, C1QC, JCHAIN, TRAC and CXCL9. Scale bars, 2 mm in a,b,g; 100 µm in c,df; 20 µm in h; 50 µm in i.
Extended Data Fig. 1
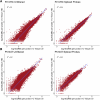
Extended Data Fig. 1. Sensitivity comparisons between Visium v2 and Visium HD performed on serial sections of normal and colon cancer samples.
a. CRC sample (P2CRC). b. Normal colon mucosa sample (P5NAT). Comparisons show strong correlation between UMI counts from all probes (54,580 probes; left panels, Unfiltered), and the probes that only span spliced gene target regions (7,605 probes; right panels, Spliced Probes), obtained from each assay, highlighting comparable sensitivity between assays. Source data
Extended Data Fig. 2
Extended Data Fig. 2. Transcript localization accuracy.
a. To assess localization accuracy of selected muscularis mucosae marker genes (ACTA2, DES, GREM1), we selected three regions of interest (ROIs) for each tissue; source masks (red) are muscularis mucosae, adjacent masks (yellow) are the immediately adjacent mucosa regions. The images show selected ROIs in a representative normal sample P5NAT. The table shows the median percentage of localized transcripts in the source in n= 3 samples (one replicate per sample). b. We analyzed the transcript localization of selected genes (MS4A1, CD52, CXCR4) known to be enriched in immune cells within lymphoid regions in three ROIs. Source masks (red) are lymphoid regions, and adjacent masks (yellow) represent the immediately adjacent submucosa areas. The images show selected ROIs in a representative normal sample P5NAT. Table shows the median percentage of localized transcripts in the source in n= 3 samples (one replicate per sample).
Extended Data Fig. 3
Extended Data Fig. 3. Cell type annotation of the sample-specific single cell reference atlas.
a. Manual classification of the graph-based clusters into nine broad cell types, denoted as level 1 annotations. Left: Bar plot showing frequency of distinct cell types across the single cell data set composed of 5 CRC sections and 3 NAT sections. Right: UMAP plot showing level 1 cell type annotations in the single cell dataset. b. Finer annotation (level 2) of the cell types identified in the single cell data Left: UMAP plots showing cell type annotations in individual samples after further sub-clustering analysis of the single cell data. Right: UMAP plot showing level 2 cell type annotations in the single cell data. Source data
Extended Data Fig. 4
Extended Data Fig. 4. Proportion of cell types identified in three CRC samples.
Barplot with the proportion of each of the identified cell types after deconvolution on the three different CRC samples. Colors represent the sample. Source data
Extended Data Fig. 5
Extended Data Fig. 5. Single cell analysis of tumor subpopulations in CRC (n=5) samples reveal tumor heterogeneity.
a. UMAP plot with tumor cells colored by cluster (left) and colored by sample identifier (right). b. Dot plot displaying the scaled expression of the top differentially expressed genes across the 5 tumor subpopulations. c. UMAP plot colored by log normalized UMI counts of differentially expressed genes and tumor markers (CEACAM5, CEACAM6).
Extended Data Fig. 6
Extended Data Fig. 6. Sketch based analysis of Visium HD data without the integration of single cell data.
a. Spatial plots with bins colored by cell type identified level 1 unsupervised clustering.Scale bar = 1mm. b. Heatmap from confusion matrix showing the relationship between cell labels provided via deconvolution (rows) and unsupervised clusters (columns). Heatmap is scaled by row, summing up to 100% per row. Longer color bars represent level 1 cell type annotations and small colored squares represent the level 2 clusters identified for each level 1 cell type. Source data
Extended Data Fig. 7
Extended Data Fig. 7. Analysis of macrophage subpopulations in normal and tumor regions of colon cancer sections.
a. Dot plot denoting the expression of differentially expressed genes in the 4 macrophages cluster identified via unsupervised clustering. b. Barplot with the proportion of each macrophage cluster. Colors represent distance to the tumor. c. Barplot with the proportion of each macrophage cluster. Colors represent the different samples. d. Spatial organization of the 4 identified macrophage populations in the colon cancer samples. Shades of gray represent normal and tumor regions in the section and colors represent the identified unsupervised clusters. Scale bars = 1mm. Source data
Extended Data Fig. 8
Extended Data Fig. 8. Deconvolution class for 8 μm bins labeled as T cells.
Barplots denoting the deconvolved class for CD4 T cells and CD8 T cells in the 50 micron TME and rest of the tissue for each patient (n= 3). Source data
Extended Data Fig. 9
Extended Data Fig. 9. Localization of CD4 and CD8 T cells.
a. Kernel density maps showing the differential spatial localization of CD4 and CD8 T cells in the CRC sections (n = 3). b. Expression of TRAC (T cell), CD3E (T cell), PECAM1 (Endothelial), IGKC (Plasma), COL1A1 (CAF), SPP1 (Macrophage), SELENOP (Macrophage) and CEACAM5 (Tumor) in the segmented nuclei for each patient. UMI counts were grouped by 2 micron bins located within each segmented nuclei. Scale bars: black = 1mm; yellow = 50µm.
Extended Data Fig. 10
Extended Data Fig. 10. Cross-platform Sensitivity.
Sensitivity comparisons between Visium HD and Xenium in situ gene expression data have been performed on serial sections from the same colon cancer FFPE blocks in a subset of 3 CRC samples. Plots show per gene pseudo bulk correlation between paired Visium HD (UMI counts) and Xenium in situ (gene counts) data. Xenium is on average 5.7x more sensitive on a per-gene basis than Visium HD for genes included in both panels at the sequencing depth used (range: 1309-1865 reads per 8 μm bin). Sensitivity was calculated by taking the geometric mean of the per gene fold difference between Visium HD and Xenium counts. Comparison of transcript diversity in the shared region found that Visium HD exhibited, on average, ~6.5x more transcripts than Xenium. See Supplementary Table 5. Source data

References

    1. Xi, Y. & Xu, P. Global colorectal cancer burden in 2020 and projections to 2040. Transl. Oncol.14, 101174 (2021). - PMC - PubMed
    1. Hossain, M. S. et al. Colorectal cancer: a review of carcinogenesis, global epidemiology, current challenges, risk factors, preventive and treatment strategies. Cancers14, 1732 (2022). - PMC - PubMed
    1. O’Connell, J. B., Maggard, M. A. & Ko, C. Y. Colon cancer survival rates with the New American Joint Committee on Cancer sixth edition staging. J. Natl Cancer Inst.96, 1420–1425 (2004). - PubMed
    1. Wang, W. et al. Molecular subtyping of colorectal cancer: recent progress, new challenges and emerging opportunities. Semin. Cancer Biol.55, 37–52 (2019). - PMC - PubMed
    1. Guinney, J. et al. The consensus molecular subtypes of colorectal cancer. Nat. Med.21, 1350–1356 (2015). - PMC - PubMed

Substances

LinkOut - more resources