

Lactate metabolism-related genes serve as potential biomarkers for predicting gastric cancer progression and immunotherapy
- PMID: 40473996
- PMCID: PMC12141176
- DOI: 10.1007/s12672-025-02782-y
Lactate metabolism-related genes serve as potential biomarkers for predicting gastric cancer progression and immunotherapy
Abstract
Background: Targeting lactate metabolism represents a promising therapeutic strategy to enhance anti-tumor immune responses. In this study, we developed a novel model based on lactate metabolism-related genes (LRGs) to predict survival, characterize the immune microenvironment, and assess immunotherapy response in gastric cancer (GC), with the potential to identify new biomarkers.
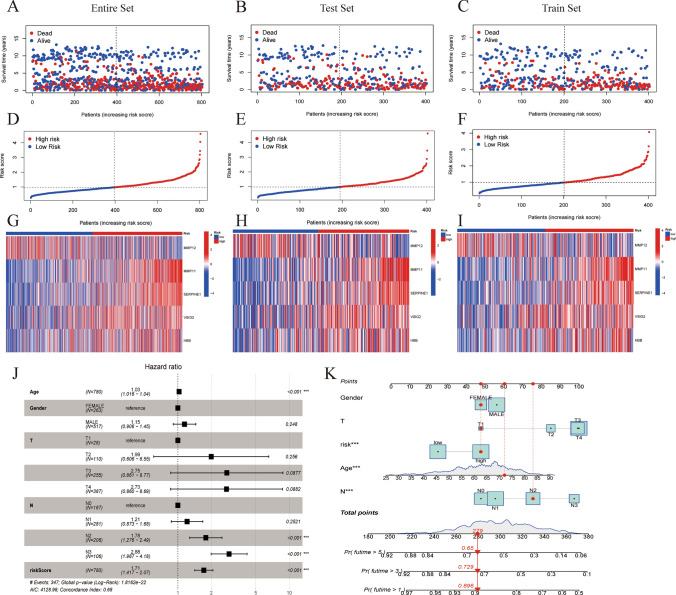
Methods: Data sets of GC patients were obtained from The Cancer Genome Atlas (TCGA) and Gene Expression Omnibus (GEO) databases. LRGs were sourced from the MSigDB database. Five key prognostic LRGs (MMP11, MMP12, HBB, VSIG2, and SERPINE1) were identified using univariate COX regression and least absolute shrinkage and selection operator (LASSO) Cox regression analyses. Patients were classified into high-risk and low-risk groups based on a median risk score. We conducted prognostic analysis, gene set enrichment analysis (GSEA), immune microenvironment analysis, immunotherapy responsiveness evaluation, and drug screening in these groups.
Results: The high-risk group exhibited poorer prognosis compared to the low-risk group, as predicted by our nomogram for overall survival. Notably, the high-risk group, marked by higher stromal cell infiltration and RNA stemness scores (RNAss), showed increased susceptibility to immune evasion. In contrast, the low-risk group demonstrated better responses to immunotherapy and greater sensitivity to chemotherapy. Single-cell analysis revealed that SERPINE1 is predominantly positively correlated with immune checkpoint expression, while VSIG2 exhibits a negative correlation.
Conclusions: We have developed and validated a novel lactate metabolism-associated model, providing new insights into the prognosis and immunotherapy of GC patients. The five identified LRGs offer potential as prognostic biomarkers and therapeutic targets in GC.
Keywords: Gastric cancer; Immunotherapy; Lactate metabolism; Prognosis; Tumor microenvironment.
© 2025. The Author(s).
Conflict of interest statement
Declarations. Ethics approval and consent to participate: The data from TCGA and GEO database is public and therefore does not require ethical approval from the relevant authorities. Consent for publication: Not applicable. Competing interests: The authors declare no competing interests.
Figures


Similar articles
-
Amino acid metabolism-related genes as potential biomarkers and the role of MATN3 in stomach adenocarcinoma: A bioinformatics, mendelian randomization and experimental validation study.Int Immunopharmacol. 2024 Dec 25;143(Pt 1):113253. doi: 10.1016/j.intimp.2024.113253. Epub 2024 Sep 30. Int Immunopharmacol. 2024. PMID: 39353384
-
Identification of cuproptosis-related subtypes, construction of a prognosis model, and tumor microenvironment landscape in gastric cancer.Front Immunol. 2022 Nov 21;13:1056932. doi: 10.3389/fimmu.2022.1056932. eCollection 2022. Front Immunol. 2022. PMID: 36479114 Free PMC article.
-
Development and validation of a hypoxia- and mitochondrial dysfunction- related prognostic model based on integrated single-cell and bulk RNA sequencing analyses in gastric cancer.Front Immunol. 2024 Aug 6;15:1419133. doi: 10.3389/fimmu.2024.1419133. eCollection 2024. Front Immunol. 2024. PMID: 39165353 Free PMC article.
-
Weighted Gene Co-expression Network Analysis Identifies a Cancer-Associated Fibroblast Signature for Predicting Prognosis and Therapeutic Responses in Gastric Cancer.Front Mol Biosci. 2021 Oct 8;8:744677. doi: 10.3389/fmolb.2021.744677. eCollection 2021. Front Mol Biosci. 2021. PMID: 34692770 Free PMC article.
-
Construction of a prognostic model for gastric cancer based on immune infiltration and microenvironment, and exploration of MEF2C gene function.BMC Med Genomics. 2025 Jan 14;18(1):13. doi: 10.1186/s12920-024-02082-4. BMC Med Genomics. 2025. PMID: 39810215 Free PMC article.
Cited by
-
The Efficacy of Neoantigen-Loaded Dendritic Cell Vaccine Immunotherapy in Non-Metastatic Gastric Cancer.Med Sci (Basel). 2025 Jul 11;13(3):90. doi: 10.3390/medsci13030090. Med Sci (Basel). 2025. PMID: 40700119 Free PMC article. Review.
References
-
- Sung H, Ferlay J, Siegel RL, Laversanne M, Soerjomataram I, Jemal A, et al. Global cancer statistics 2020: GLOBOCAN estimates of incidence and mortality worldwide for 36 cancers in 185 countries. CA Cancer J Clin. 2021;71(3):209–49. - PubMed
-
- Thrift AP, Wenker TN, El-Serag HB. Global burden of gastric cancer: epidemiological trends, risk factors, screening and prevention. Nat Rev Clin Oncol. 2023;20(5):338–49. - PubMed
-
- Allemani C, Matsuda T, Di Carlo V, Harewood R, Matz M, Nikšić M, et al. Global surveillance of trends in cancer survival 2000–14 (CONCORD-3): analysis of individual records for 37 513 025 patients diagnosed with one of 18 cancers from 322 population-based registries in 71 countries. Lancet. 2018;391(10125):1023–75. - PMC - PubMed
Grants and funding
- 2024308001/Science and Technology Development Plan of Jinan Municipal Health Commission
- No. ZR2023QH436/Shandong Provincial Natural Science Foundation of China
- ZR2023QH463/Shandong Provincial Natural Science Foundation of China
- No. YXH2022ZX02036/Shandong Medical Association Clinical Research Fund-Qilu Special Project
- No. 82403361/Natural Science Foundation of China
LinkOut - more resources
Full Text Sources
Miscellaneous