. 2025 Jul;44(14):3983-4012.
doi: 10.1038/s44318-025-00477-2. Epub 2025 Jun 5.

A capsular myofibroblastic niche maintains hematopoietic stem cells in the spleen

Affiliations

A capsular myofibroblastic niche maintains hematopoietic stem cells in the spleen

Shubham Haribhau Mehatre et al. EMBO J. 2025 Jul.

Abstract

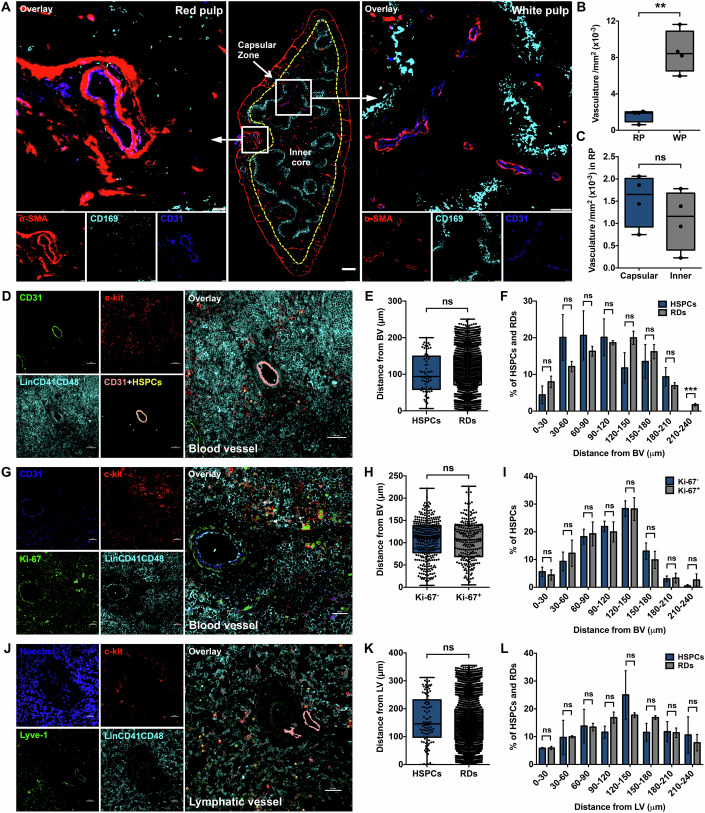
The spleen is a key site for extramedullary hematopoiesis that hosts a rare population of functional hematopoietic stem cells (HSCs). While the microenvironment that supports extramedullary hematopoiesis response has gained interest, a niche for splenic HSCs at steady-state remains undescribed. Here, we have uncovered a red-pulp-specific, myofibroblastic niche that supports murine splenic HSCs within a ≈ 200-μm-wide capsular zone. Detailed spatial-distribution and perturbation analysis showed the importance of myofibroblasts in maintaining HSCs in a quiescent state. Unlike reported for the adult bone marrow, the HSCs in splenic niche were not spatially associated with vascular components. G-CSF-mediated chemokine alteration and 5-FU-induced proliferation resulted in HSCs shifts away from the splenic capsule. Interestingly, upon regaining quiescence, the HSCs re-occupied niches close to capsular myofibroblasts. Proteomic interactome profiles confirmed the relevance of capsular myofibroblasts for splenic HSCs and identified potential niche regulators of HSC maintenance. Together, this study demonstrates a dynamic HSC localization in the spleen and its niche context at homeostasis and under stress. It offers a model to uncover novel regulators crucial for HSC function.

Keywords: Hematopoietic Niche; Hematopoietic Stem Cells; Myofibroblasts; Proteomics; Spleen.


Conflict of interest statement

Disclosure and competing interests statement. The authors declare no competing interests.

Figures

Figure 1
Figure 1. Splenic HSCs are spatially associated with α-SMA+ capsular myofibroblasts.
(A) Flow cytometry was performed on splenic MNCs to select the marker combination to identify primitive HSCs (pHSCs or CD150+CD41-CD48-LSK cells) using three fluorophores. The proportion of pHSCs in Lin-CD41-CD48-(or 3-)CD150+c-kit+, 3-CD150+Sca-1+ and 3-Sca-1+c-kit+ cells was examined and plotted (n = 7). (B) Representative image showing confocal imaging based immunolocalization of pHSCs in a splenic cross-section. The pHSCs were identified as 3-CD150+c-kit+ cells; one single pHSC is shown in magnified inset. Scale bars, 20 μm (left panel) and 5 μm (right panel). (C) Confocal-based immunolocalization of pHSCs in splenic red pulp (RP). The white pulp (WP) boundary was identified by immunostaining for CD169+ marginal zone macrophages along with pHSC markers (scale bar = 30 μm). (D) Representative confocal image showing an entire WP zone bordered with marginal zone macrophages identified using immunostaining for CD169 as mentioned in (C) (scale bar = 30 μm). (E) Comparison of proportion of pHSCs within the RP and WP areas of the spleen. Primitive HSCs were identified using immunostaining and localized with reference to CD169 expression, marking the periphery of WP (n = 9). (F) Confocal imaging to localize pHSCs along with capsular and trabecular myofibroblasts in spleen sections. Immunostaining was performed for myofibroblast cell marker α-SMA, along with the markers to identify pHSCs. Pseudo-surfaces for pHSCs (illuminated yellow) and capsular myofibroblasts (illuminated white) were generated using Imaris. The Euclidean distances from surface of pHSCs with respect to the nearest observable capsular myofibroblast in the spleen was determined. Scale bars = 20 μm (left panel), 5 μm (right panel). (G) Spatial distribution frequency of pHSCs in sequential intervals of 100 μm relative to capsular myofibroblasts (n = 4; N = 20 images). (H) Confocal imaging to immunolocalize pHSCs along with α-SMA+ capsular myofibroblasts. Euclidean distances relative to splenic capsule were measured for each pHSC detected, and an equivalent number of RDs with 100 iterations employed (scale bar = 20 μm). (I) Comparison of Euclidean distances measured for pHSCs and RDs with reference to the nearest observable of α-SMA+ capsular myofibroblast in splenic sections (n = 3, N = 667 pHSCs; each dot represents a pHSC or an RD). (J) Distribution frequency of pHSCs and RDs at sequential intervals (30 μm each) from the splenic capsule identified by α-SMA immunostaining. The pHSCs were identified as 3-c-kit+CD150+ cells in the splenic tissue, and the surfaces and RDs were generated using Imaris (n = 3, N = 667 pHSCs). Data is presented as bar graph (mean ± SEM) in panels (E, J) or box-whiskers plot (median with min to max) in panels (A, G, I). The p-value in figures (A, E, G, I, J) were calculated by the Student’s t-test, *p < 0.05, ***p < 0.001, ****p < 0.0001, and ns p > 0.05.
Figure 2
Figure 2. Proliferation state-dependent localization of HSCs within splenic capsular niche.
(A) Euclidean distances calculated for each pHSC with reference to pseudo-surfaces of capsular myofibroblasts in the spleen tissues harvested from male and female mice. Each dot represents a pHSC immunolocalized as a 3-c-kit+CD150+ cell by confocal imaging (n = 3, N; male = 320, female = 667 pHSCs). (B) Distribution frequency of pHSCs at sequential distance intervals (30 μm each) relative to the splenic capsule in spleen tissues isolated from male and female mice (n = 3, N; male = 320, female = 667 pHSCs). (C) Euclidean distances calculated for HSPCs relative to the capsular surfaces of spleen tissues from male and female mice (n = 3, N; male = 367, female = 818 HSPCs). (D) Confocal images showing quiescent (Ki-67-; left panel) and proliferative (Ki-67+; right panel) pHSCs identified by immuostaining (scale bar = 3 μm). (E) Confocal images showing quiescent (Ki-67-; left panel) and proliferative (Ki-67+; right panel) HSPCs identified by immunostaining (scale bar = 3 μm). (F) Comparison of Euclidean distances between Ki-67- and Ki-67+ pHSCs from the nearest detectable capsular myofibroblast. Immunostaining was performed to detect Ki-67 expression in 3-c-kit+CD150+ cells, surface generation and distance analysis was performed on Imaris (n = 4, N; Ki-67- = 248, Ki-67+ = 309 pHSCs). (G) Comparison of Euclidean distances between Ki-67- and Ki-67+ HSPCs from the nearest detectable capsular myofibroblast. Immunostaining was performed to detect Ki-67 expression in 3-c-kit+ cells (n = 4, N; Ki-67- = 307, Ki-67+ = 363 HSPCs). (H) Comparison between the frequency of Ki-67- and Ki-67+ pHSCs for their distribution within the sequential distance intervals (30 μm each) relative to the capsular surface in spleen tissues (n = 4, N; Ki-67- = 248, Ki-67+ = 309 pHSCs). (I) Distribution frequency of Ki-67- and Ki-67+ HSPCs at sequential distance intervals relative to the splenic capsule in spleen tissues (n = 4, N; Ki-67- = 307, Ki-67+ = 363 HSPCs). Data is presented as bar graph (mean ± SEM) in panels (B, H, I) or box-whiskers plot (median with min to max) in panels (A, C, F, G). The p-value in figures (AC, FI) were calculated by the Student’s t-test, **p < 0.01, ***p < 0.001, ****p < 0.0001, and ns p > 0.05, and ND indicates not detected.
Figure 3
Figure 3. Splenic vessels do not contribute to hematopoietic niche creation.
(A) Immunostaining was performed to detect vasculature within WP and RP areas in the spleen, and tile scans of splenic CS were acquired. Splenic CS is divided into 200 μm wide peripheral capsular zone and inner core. Marginal macrophages lining the WP areas were immunostained for CD169 along with pan-endotheilal marker CD31 and vascular smooth muscle cell marker α-SMA (Middle panel; scale bar = 200 μm). Left panel; zoomed confocal images showing a large blood vessel in the RP of the splenic CS (scale bar = 20 μm). Right panel; zoomed confocal images showing blood vessels in the WP of splenic CS with (scale bar = 50 μm). (B) Comparison of vascular distribution within the RP and WP areas of the spleen. Blood vessels were identified using immunostaining and localized with reference to the CD169 demarcating WP from RP. Proportion of vascular area normalized to RP and WP areas in spleen tissues was compared (n = 4). (C) Comparison of vascular distribution within the 200 μm wide capsular zone and inner core of the spleen in RP area. Blood vessels were identified using immunostaining and localized with reference to the CD169. Proportion of vascular area normalized to the areas covered in capsular zone and inner splenic core was compared (n = 4). (D) Confocal imaging to localize HSPCs along with the vascular endothelial cells in spleen sections. Immunostaining was performed for vascular endothelial marker CD31, along with markers to identify HSPCs. Pseudo-surfaces for HSPCs (illuminated yellow) and blood vessels (illuminated salmon) were generated using Imaris. The Euclidean distance from surfaces of HSPCs and RDs with respect to the nearest observable blood vessel in the spleen was determined. Scale bars = 40 μm. (E) Comparison of Euclidean distances measured for HSPCs and RDs with reference to the nearest observable of CD31+ blood vessel in splenic sections (n = 3, N = 64 HSPCs; each dot represents a HSPC or an RD). (F) Distribution frequency of HSPCs and RDs at sequential intervals (30 μm each) from the blood vessels identified by CD31 immunostaining (n = 3, N = 64 HSPCs). (G) Confocal images of spleen CS immunostained to localize Ki-67+ and Ki-67- HSPCs along with CD31+ blood vessels. The HSPCs were identified as 3-c-kit+ cells (scale bar = 20 μm). (H) Comparison of Euclidean distances between Ki-67- and Ki-67+ HSPCs from the nearest detectable blood vessel (n = 8, N; Ki-67- = 337, Ki-67+ = 239 HSPCs). (I) Comparison of the frequency of Ki-67- and Ki-67+ HSPCs within sequential distance intervals (30 μm each) relative to the blood vessels in spleen tissues (n = 8, N; Ki-67- = 337, Ki-67+ = 239 HSPCs). (J) Confocal imaging to localize HSPCs along with lymphatic vessels in spleen sections. Immunostaining was performed for lymphatic vessel marker Lyve-1, along with markers to identify HSPCs. Pseudo-surfaces for HSPCs (illuminated yellow) and lymphatic vessels (illuminated salmon) were generated using Imaris (scale bars = 30 μm). (K) Comparison of Euclidean distances measured for HSPCs and RDs with reference to the nearest observable Lyve-1+ lymphatic vessel in splenic sections (n = 4, N = 90 HSPCs; each dot represents a HSPC or an RD). (L) Distribution frequency of HSPCs and RDs at sequential intervals (30 μm each) from the lymphatic vessels (n = 4, N = 90 HSPCs). Data is presented as bar graph (mean ± SEM) in panels (F, I, L) or box-whiskers plot (median with min to max) in panels (B, C, E, H, K). The p-value in figures (B, C, E, F, H, I, K, L) were calculated by the Student’s t-test, **p < 0.01, ***p < 0.001, and ns p > 0.05.
Figure 4
Figure 4. G-CSF mediated proliferation shifts HSCs away from capsular myofibroblasts.
(A) Immunostaining was performed to detect SDF-1α with reference to WP and RP areas in the spleen, and tile scans of splenic CS were acquired. Marginal macrophages lining the WP areas were immunostained for CD169 along with SDF-1α and pan-leukocyte antigen CD45 (scale bar = 200 μm). (B) Confocal images showing SDF-1α expression in RP (left panel) and WP (right panel) areas in spleen tissue. Immunostaining was performed to detect the expression of CD169 marking the periphery of WP areas. The right panel shows an entire WP zone in the splenic section (scale bar = 20 μm). (C) Detection of SDF-1α expression in vascular smooth muscle cells identified by α-SMA expression. Confocal images show a vessel in the splenic section with immunostaining performed for SDF-1α along with α-SMA and nuclear staining with Hoechst 33342 (scale bar = 5 μm). (D) Comparison of Sdf-1α transcript levels in splenic Lin- cells and myofibroblasts from the fibrous tissue relative to the BM Lin- cells. Quantitative RT-PCR was performed on the RNA isolated from the murine spleen cells, and the graph shows relative gene expression (n = 4, 8). (E) Comparison of RP and WP areas in spleen CS following G-CSF treatment. WP areas were detected by immunostaining for CD169. RP areas were quantified exclusive of WP, vasculature, trabecular, and capsular areas (n = 4, N = 12 tile scans). (F) Flow cytometry based quantification of LT-HSC (Lin-CD41-CD48-Sca-1+c-kit+CD150+ cells) and ST-HSC (Lin-CD41-CD48-Sca-1+c-kit+CD150- cells) frequency in spleen with and without G-CSF treatment (n = 6). (G) Flow cytometry analysis to examine the cell cycle status of HSCs (Lin-CD41-CD48-Sca-1+c-kit+ cells) in the spleen with and without G-CSF treatment. DAPI and Ki-67 based analysis for G0, G1, S, and G2M stages of cell cycle was performed along with immunostaining for HSC markers (n = 3). (H) Confocal images of spleen CS immunostained to localize Ki-67+ and Ki-67- pHSCs. The spleen tissues were taken from mice treated with (right panel) or without (left panel) G-CSF, and the pHSCs were identified as 3-c-kit+CD150+ cells (scale bar = 30 μm). (I) Euclidean distances calculated for each pHSC with reference to pseudo-surfaces of capsular myofibroblasts in the spleen with or without G-CSF treatment. Each dot represents a pHSC immunolocalized as a 3-c-kit+CD150+ cell by confocal imaging (n = 6, N; control = 707, G-CSF = 957 pHSCs). (J) Distribution frequency of pHSCs at sequential distance intervals (30 μm each) relative to the splenic capsule in spleen tissues with or without G-CSF treatment (n = 6, N; control = 707, G-CSF = 957 pHSCs). (K) Comparison of Euclidean distances for Ki-67- and Ki-67+ pHSCs relative to the nearest capsular surfaces detected in spleen sections from G-CSF treated mice (n = 6, N; Ki-67- = 404, Ki-67+ = 553 pHSCs). (L) Comparison between Ki-67- and Ki-67+ pHSCs for their distribution frequency within the sequential distance intervals relative to capsular surface in spleen tissues after G-CSF treatment (n = 6, N; Ki-67- = 404, Ki-67+ = 553 pHSCs). (M) Euclidean distances calculated for Ki-67- pHSCs relative to the nearest observable capsular myofibroblast of spleen tissues from the control and G-CSF treated mice (n = 6, N; Control = 301, GCSF = 404 Ki-67- pHSCs). (N) Distribution frequency of Ki-67- pHSCs at sequential distance intervals relative to the capsular surface in spleen tissues with or without G-CSF treatment (n = 6, N; Control = 301, GCSF = 404 Ki-67- pHSCs). (O) Euclidean distances calculated for Ki-67+ pHSCs relative to the capsular surfaces of spleen tissues treated with or without G-CSF (n = 6, N; Control = 406, G-CSF = 553 Ki-67+ pHSCs). (P) Distribution frequencies of Ki-67+ pHSCs at different distance intervals relative to the capsular surface in spleen tissues with or without G-CSF treatment (n = 6, N; Control = 406, G-CSF = 553 Ki-67+ pHSCs). Data is presented as bar graph (mean ± SEM) in panels (J, L, N, P) or box-whiskers plot (median with min to max) in panels (DG, I, K, M, O). The p-value in figures (DG, IP) were calculated by the Student’s t-test, *p < 0.05, **p < 0.01, ***p < 0.001, ****p < 0.0001, and ns p > 0.05.
Figure 5
Figure 5. Reversal of spatial distribution of pHSCs following re-attainment of steady state.
(A) Comparison of cross-sectional area of the murine spleen tissues harvested from control and G-CSF treated animals. G-CSF treatment was given for 5 days and the mice were sacrificed one day (G-CSF) or 30 days (G-CSF Rev) after the treatment (n = 6, N = 12 tile scans). (B) Comparison of total spleen cellularity in control and the two groups of G-CSF treated mice. MNCs were harvested from spleen tissues without enzymatic treatment, and viable cell counts were taken using a Neubauer chamber after RBC lysis (n = 6). (C) Comparison of the proportion of splenic HSC population in different stages of cell cycle analyzed by flow cytometry. DAPI and Ki-67 based analysis for G0, G1, S, and G2M stages of cell cycle was performed along with immunostaining for HSC markers (Gating strategy is represented in EV3X) (n = 3). (D) Euclidean distances calculated for each pHSC with reference to pseudo-surface of capsular myofibroblasts in the spleen from control, G-CSF and G-CSF Rev groups of mice. Each dot represents a pHSC immunolocalized as a 3-c-kit+CD150+ cell by confocal imaging (n = 6, N; control = 707, G-CSF = 957 and G-CSF Rev = 629 pHSCs). (E) Distribution frequency of pHSCs at sequential distance intervals (30 μm each) relative to the splenic capsule in spleen of control, G-CSF treated and mice undergone one month incubation after G-CSF treatment (G-CSF Rev) (n = 6, N; control = 707, G-CSF = 957 and G-CSF Rev = 629 pHSCs). (F) Confocal imaging to localize HSPCs (3-c-kit+ cells; illuminated yellow) along with vascular endothelial cells (identified by CD31 expression) in spleen sections from control (upper panel) and G-CSF treated mice (lower panel). Scale bars = 40 μm. (G) Comparison of Euclidean distances measured for HSPCs with reference to the nearest observable of CD31+ blood vessel in splenic CS of control and G-CSF treated mice (n = 4, N; control = 161, G-CSF = 326 HSPCs). (H) Distribution frequency of HSPCs in splenic CS of control and G-CSF treated mice at sequential intervals (30 μm each) from the blood vessels (n = 4, N; control = 161, G-CSF = 326 HSPCs). Data is presented as bar graph (mean ± SEM) in panels (C, E, H) or box-whiskers plot (median with min to max) in panels (A, B, D, G). The p-value in figures (AE, G, H) were calculated by the Student’s t-test, *p < 0.05, **p < 0.01, ***p < 0.001, ****p < 0.0001, and ns p > 0.05.
Figure 6
Figure 6. SDF-1α expressing myofibroblasts but not stromal cells support splenic HSPCs.
(A) Confocal microscopy performed to locate HSPCs (3-c-kit+ cells) along with α-SMA and SDF-1α by immunostaining of splenic CS from control (left) and G-CSF treated (right) mice (scale bar = 30 μm). (B) Immunostaining images after pseudo-surface generation for each HSPC detected along with signals for α-SMA and SDF-1α expression. Surface generation was performed using Imaris for immunostained spleen CS from control (left) and G-CSF treated (right) mice (scale bar = 30 μm). (C) Heatmap generated on Imaris for comparative analysis of SDF-1α expression in confocal based immunofluorescence images from control (left) and G-CSF treated (right) mice (scale bar = 30 μm). (D) Immunofluorescence-based quantification of SDF-1α expression in capsular and stromal RP cells of spleen tissue from control and G-CSF treated mice (n = 6, N = 30 images). (E) Pseudo-surface generation on immunolocalized HSPCs with an equal number of RDs (100 iterations) generated on confocal images. Euclidean distances for HSPCs (yellow) and RDs with respect to the nearest observable SDF-1α+ cells in the splenic RP area were determined. (F) Comparison of Euclidean distances between HSPCs and RDs from the nearest detected SDF-1α+ splenic RP cells (SRCs) (n = 3, N = 87). (G) Distribution frequencies of HSPCs and RDs in splenic tissue at sequential intervals of 10 μm, relative to the SDF-1α+ SRCs (n = 3, N = 87). (H) Comparison of Euclidean distances between HSPCs and the nearest detected SDF-1α+ SRCs in control and G-CSF treated mice. Each dot represents an HSPC detected based on immunostaining (n = 3, N; Control = 87, G-CSF = 64 pHSCs). (I) Distribution frequency of HSPCs relative to the SDF-1α+ SRCs in control and G-CSF treated mice. The proportion of HSPCs at sequential intervals (10 μm each) with reference to the candidate niche cells is presented for the two groups of mice (n = 3, N; Control = 87, G-CSF = 64 pHSCs). Data is presented as bar graph (mean ± SEM) in panels (FI) or box-whiskers plot (median with min to max) in panel (D). The p-value in figures (D, FI) were calculated by the Student’s t-test, **p < 0.01, ****p < 0.0001, and ns p > 0.05, and ND indicates not detected.
Figure 7
Figure 7. Myeloablation induced proliferation relocates pHSCs away from the capsule in an expanded hematopoietic zone.
(A) Change in the spleen weight (in grams) after 7 days of 5-FU treatment (n = 5–6). (B) Splenic CS immunostained for CD169 to identify marginal zone macrophages lining the WP areas. The tissues were harvested from the control (left panel) and 5-FU (right panel) treated mice. Nuclei were counterstained with Hoechst 33342 (scale bar = 200 μm). (C) Comparison of cross-sectional areas of the spleen tissues harvested from control and 5-FU treated mice (n = 3, N = 9 tile scans). (D) Comparison of RP and WP areas in spleen sections following 5-FU treatment. WP areas were detected by the presence of marginal zone macrophages identified by immunostaining for CD169. RP areas were quantified exclusive of WP, vasculature, trabecular, and capsular areas (n = 3, N = 9). (E) Flow cytometry analysis to compare cell cycle status of HSCs in the spleen with and without 5-FU treatment (same control samples were used for data presented in Fig. EV3X and Appendix Fig. S1H). DAPI and Ki-67 based analysis for G0, G1, S and G2M stages of cell cycle was performed along with immunostaining for HSC (Lin-CD41-CD48-Sca-1+c-kit+ cells) markers. (F) Comparison of proportion of splenic HSCs from control and 5-FU treated mice in different stages of cell cycle (Gating strategy is represented in (E)) (n = 3–4). (G) Flow cytometry analysis to examine LT-HSC (Lin-CD41-CD48-Sca-1+c-kit+CD150+ cells) and ST-HSC (Lin-CD41-CD48-Sca-1+c-kit+CD150- cells) populations within the MNCs from spleen of control (same data used for Appendix Fig. S1F) and 5-FU treated mice. (H) Comparison of LT-HSC and ST-HSC frequency (cells/million) in spleen tissues treated with and without 5-FU (n = 4–6). (I) Confocal images of spleen CS immunostained to localize Ki-67+ and Ki-67- pHSCs. The spleen tissues were taken from mice treated with (right panel) or without (left panel) 5-FU, and the pHSCs were identified as 3-c-kit+CD150+ cells (scale bar = 50 μm). (J) Euclidean distances calculated for each pHSC with reference to nearest capsular surface in the spleen with or without 5-FU treatment. Each dot represents a pHSC immunolocalized as a 3-c-kit+CD150+ cell by confocal imaging (n = 4–6, N; Control = 707, 5-FU = 660 pHSCs). (K) Distribution frequency of pHSCs at sequential intervals (30 μm each) relative to capsular myofibroblast in spleen tissues with or without 5-FU treatment (n = 4–6, N; Control = 707, 5-FU = 660 pHSCs). Data is presented as bar graph (mean ± SEM) in panel (K) or box-whiskers plot (median with min to max) in panels (A, C, D, F, H, J). The p-value in figures (A, C, D, F, HK) were calculated by the Student’s t-test, **p < 0.01, ****p < 0.0001, and ns p > 0.05.
Figure 8
Figure 8. Interactome analysis based on quantitative proteomics identifies myofibroblasts-biased HSPC associations.
(A) Schematic showing the experimental design followed for quantitative proteome assessment of the candidate cell types that constitute HSC niche in the spleen. Spleen tissue is ruptured and processed to obtain spleenocytes and fibrous material containing capsular and trabecular myofibroblasts (CTMs). MNCs were used to FACS sort LSK cells and Lin-CD45- stromal cells (STCs). The cells were lysed by sonication and the lysates were further processed for protein alkylation with IAA and reduction by DTT treatment before trypsinization and desalting. Trypsinized peptides were analyzed by label-free nano-LC-MS/MS followed by computational analysis (n = 6; each sample was analyzed with 3 runs, N = 18). (B) Principal component analysis was performed on untargeted proteomic profiles of CTM, STC, and LSK cell samples from the spleen tissues of young adult mice. (C) Hierarchical clustering of differentially expressed proteins detected and quantified by mass spectrometry. (D) Venn diagram analysis of the proteomes detected from the CTM, STC, and LSK cells. The number of proteins differentially expressed (adjusted p-value < 0.05 and fold change > 2) between each pair (commonly or exclusively) of cell populations (CTMs versus STCs, LSKs versus STCs, and LSKs versus CTMs) is shown. (E) Volcano plots showing proteins differentially expressed between CTM versus STC populations (n = 6; each sample was analyzed with 3 runs, N = 18). Fold change (Log2 values) and adjusted p-values (−log10 values) are plotted on the x and y axes, respectively. Cyan colored dots represent proteins with statistically significant (adjusted p-value < 0.05) increase in abundance in the CTMs with fold change > 2.0. Red colored dots represent proteins having statistically significant (adjusted p-value < 0.05) decrease in abundance in CTMs with fold change > 2.0. (F) Volcano plots showing differentially enriched secretory proteins compared between CTM versus ST populations (n = 6; each sample was analyzed with 3 runs, N = 18). (G) Chord diagram illustrating the pathways detected in the LSK cells (upper half; cyan semicircle) that are regulated by (adjusted p-value < 0.05 and fold change > 2) the secretory proteins (lower half; gray semicircle) enriched in the STCs (black line of inner circle) and CTMs (red line of inner circle). The inner circle of the top section represents cellular processes influenced exclusively (CTMs in green and STMs in violet) or commonly (yellow) by the two niche cell types. Each top-bottom chord connection represents a predicted regulation of HSPC by niche cells. (H) CellPhoneDB based chord diagram illustrating the ligand-receptor communications between the ECM proteins expressed by niche cell types (STC proteins in black, CTM proteins in pink) and potential integrin dimers of monomers detected in LSKs (in cyan). Each chord represents a predicted interaction between an ECM protein with the cell surface expressed integrin protein. The thickness of the chord in the upper section represents the interaction score between the ligand-receptor pair. Represented data are based on six independent biological replicates (n = 6), each with three technical replicates (N = 18).
Figure 9
Figure 9. A new model of HSC niche in spleen under homeostatic conditions.
A narrow hematopoietic zone close to capsular myofibroblasts hosts HSCs. The distribution of HSCs within this capsular niche is determined by their proliferative state. Within the hematopoietic zone, the proliferative HSCs get located away from the myofibroblasts in an inducible manner.
Figure EV1
Figure EV1. Capsular myofibroblasts constitute to the hematopoietic niche in adult spleen.
(A) Flow cytometry was performed to evaluate different marker combinations for identifying primitive HSCs (pHSCs or CD150+CD41-CD48-LSK cells) using three fluorophores. The Lin-CD41-CD48- (or 3-) cells (Ai) were further gated on CD150+c-kit+ (Aii), CD150+Sca-1+ (Aiii), and Sca-1+c-kit+ (Aiv) cells; and the proportion of pHSCs in each one of them was examined (n = 7). (B) Representative confocal images showing immunofluorescence-based localization of 3-c-kit+ HSPCs, along with α-SMA+ capsular myofibroblasts. Pseudo surfaces for HSPCs (illuminated yellow) and capsular myofibroblast (illuminated white) were generated using Imaris. The Euclidean distance from the surfaces of HSPCs with respect to the nearest observable capsular myofibroblast in the spleen was determined. Scale bars = 20 μm (left panel), 3 μm (right panel). (C) Spatial distribution frequency of HSPCs in sequential intervals of 100 μm relative to capsular myofibroblasts (n = 4; N = 20 images). (D) Confocal based immunofluorescence imaging to locate 3-c-kit+ HSPCs along with α-SMA+ capsular myofibroblasts. Pseudo surfaces for HSPCs (illuminated yellow) and capsular myofibroblast (illuminated white) were generated using Imaris. An equivalent number of RDs, as that of HSPCs identified, were generated, and 100 iterations were performed for analysis. The Euclidean distances from the HSPC cell surfaces and RDs, with respect to the nearest observable capsular myofibroblast in the spleen were determined (scale bar = 20 μm). (E) Comparison of Euclidean distances measured for HSPCs and RDs with reference to the nearest observable of α-SMA+ capsular myofibroblast in splenic sections (n = 3, N = 818 HSPCs; each dot represents an HSPC or an RD). (F) Distribution of HSPCs and RDs at sequential intervals (30 μm each) from the splenic capsule identified by α-SMA immunostaining. The HSPCs were identified as 3-c-kit+ cells in the splenic tissue, and the surfaces and RDs were generated using Imaris (n = 3, N = 818 HSPCs). (G) The proportion of Ki-67- (quiescent) and Ki-67+ (proliferative) cells with pHSC and HSPC populations identified by confocal based imaging of immunostained spleen sections (n = 4, N; pHSCs = 557, HSPCs = 670). Data is presented as bar graph (mean ± SEM) in panel (F) or box-whiskers plot (median with min to max) in panels (C, E) or stacked bars in (G). The p-value in figures (CF) were calculated by the Student’s t-test, *p < 0.05, **p < 0.01, ****p < 0.0001, and ns p > 0.05.
Figure EV2
Figure EV2. G-CSF infusion leads to alterations of hematopoietic niche factors in spleen.
(A) Immunostaining was performed to detect lymphatic vessels in the spleen using antibodies against lymphatic vessel endothelial hyaluronan receptor 1 (Lyve-1). Counterstaining was performed with Hoechst 33342 and confocal based imaging was performed (scale bar = 15 μm). Splenic CS is divided into 200 μm wide peripheral capsular zone and inner core. (B) Comparison of blood and lymphatic vessel area in splenic tissue normalized to total splenic CS area (n = 4). (C) Comparison of vascular distribution of lymphatic vessels in the 200 μm wide peripheral capsular zone and inner core area in the RP of splenic CS (n = 4). (D) Confocal microscopy was performed to locate SDF-1α expression in the spleen tissue with reference to hematopoietic and non-hematopoietic fractions identified based on the expression pan-leukocyte antigen CD45 (scale bar = 20 μm). (E) Immunodetection of SDF-1α expression in splenic capsular and trabecular myofibroblasts identified by α-SMA expression. Confocal images show small vessels and trabecular area in the splenic section with immunostaining performed for SDF-1α along with α-SMA and nuclear staining with Hoechst 33342 (scale bar = 20 μm). (F) Detection and comparison of transcript levels of known hematopoietic regulators Ang1, Vcam-1, Epo, Ccl2, Scf, Tpo, IL-6, Postn, Icam-1, and Sdf-1α in splenic myofibroblasts in comparison to Lin- splenic cells by qRT-PCR (n = 3–6). (G) Detection and comparison of transcript levels of known hematopoietic regulators Ang1, Vcam-1, Epo, Ccl2, Scf, Tpo, IL-6, Postn, Icam-1, and Sdf-1α in splenic myofibroblasts in comparison to Lin- splenic cells by qRT-PCR; dCq values are compared for each gene (n = 6). (H) Effect of G-CSF treatment on the expression of Sdf-1α levels in Lin- spleen cells and myofibroblasts. Quantitative RT-PCR was performed to quantify the transcript levels in the harvested cells and the graph shows relative change in the gene expression with and without G-CSF treatment (n = 6, 8). (I) Change in the transcript levels of Ang1, Vcam-1, Epo, Ccl2, Scf, Tpo, IL-6, Postn, Icam-1, and Sdf-1α in splenic myofibroblasts after G-CSF treatment. The gene expression level was quantified by performing qRT-PCR, and relative change in the abundance of transcripts following G-CSF treatment was plotted (n = 6). (J) Effect of G-CSF treatment on the transcript levels of Ang1, Vcam-1, Epo, Ccl2, Scf, Tpo, IL-6, Postn, Icam-1, and Sdf-1α in splenic myofibroblasts. The gene expression level was quantified by performing qRT-PCR, and the change in dCq values for each gene was examined following G-CSF treatment (n = 6). (K) Quantitative RT-PCR to examine the change in the transcript levels of Ang1, Vcam-1, Epo, Ccl2, Scf, Tpo, IL-6, Postn, Icam-1, and Sdf-1α in lineage-depleted splenic pulp cells after G-CSF treatment. Relative change in the abundance of transcripts is plotted (n = 4–6). (L) Change in the transcript levels of hematopoietic regulators in lineage-depleted splenic pulp cells after G-CSF treatment; dCq values before and after G-CSF treatment are compared for each gene (n = 6). Data is presented as bar graph (mean ± SEM) in panels (F, G, IL) or box-whiskers plot (median with min to max) in panels (B, C, H). The p-value in figures (B, C, FL) were calculated by the Student’s t-test, *p < 0.05, **p < 0.01, ***p < 0.001, ****p < 0.0001, and ns p > 0.05, and ND indicates not detected.
Figure EV3
Figure EV3. G-CSF treatment induces HSC mobilization and shift in HSCs away from capsular myofibroblasts.
(AF) Methylcellulose based colony formation assays were performed to examine hematopoietic progenitor populations in the BM (n = 7–8). The frequency of (A) CFU-Gs, (B) CFU-Ms, (C) CFU-GMs, (D) BFU-Es, (E) CFU-GEMMs, and (F) total CFUs per 1 × 10⁵ cells in the BM was compared with and without G-CSF treatment. (GL) Comparison of the circulating hematopoietic progenitors in PB of mice treated with and without G-CSF (n = 7–8). The frequency of (G) CFU-Gs, (H) CFU-Ms, (I) CFU-GMs, (J) BFU-Es, (K) CFU-GEMMs, and (L) total CFUs in the MNCs harvested from 200 μl blood was plotted. (MR) Colony formation assays were performed to examine the effect of G-CSF treatment on splenic hematopoietic progenitor populations (n = 7–8). The frequency of (M) CFU-Gs, (N) CFU-Ms, (O) CFU-GMs, (P) BFU-Es, (Q) CFU-GEMMs, and (R) total CFUs per 1 x 105 MNCs harvested from spleen tissues was compared. (S) Euclidean distances calculated for Ki-67- HSPCs (3-c-kit+ cells) relative to the nearest observable capsular myofibroblast of spleen tissues from control and G-CSF treated mice (n = 6, N; Control = 370, GCSF = 500 Ki-67- HSPCs). (T) Distribution of Ki-67- HSPCs at sequential distance intervals (30 μm each) relative to the capsular surface in spleen tissues with or without G-CSF treatment (n = 6, N; Control = 370, GCSF = 500 Ki-67- HSPCs). (U) Euclidean distances calculated for Ki-67+ HSPCs relative to the capsular surfaces of spleen tissues treated with or without G-CSF (n = 6, N; Control = 466, G-CSF = 604 Ki-67+ HSPCs). (V) Distribution frequency of Ki-67+ HSPCs at sequential distance intervals relative to the capsular surface in spleen tissues with or without G-CSF treatment (n = 6, N; Control = 466, G-CSF = 604 Ki-67+ HSPCs). (W) Euclidean distances calculated for each pHSC with reference to pseudo-surfaces of capsular myofibroblast in the spleens harvested from male and female mice after G-CSF treatment. Each dot represents a pHSC immunolocalized as a 3-c-kit+CD150+ cell by confocal imaging (n = 3, N; male = 510, female = 447 pHSCs). (X) Flow cytometry analysis performed to analyze the cell cycle status of HSCs (Lin-CD41-CD48-Sca-1+c-kit+ cell population) from the spleen tissues. Spleen tissues were harvested from control and G-CSF treated animals (same samples were used for data presented in Fig. 7E and Appendix Fig. S1H). G-CSF treatment was given for 5 days and the mice were sacrificed one day (G-CSF) or 30 days (G-CSF Rev) after the treatment. Data is presented as bar graph (mean ± SEM) in panels (T, V) or box-whiskers plot (median with min to max) in panels (AE, GK, MQ, S, U, W) or stacked bars in panel (F, L, R). The p-value in figures (AW) were calculated by the Student’s t-test, *p < 0.05, **p < 0.01, ***p < 0.001, ****p < 0.0001, and ns p > 0.05.
Figure EV4
Figure EV4. 5-FU mediated myeloablation reorganizes hematopoietic niche in spleen.
(A) Comparison of total spleen cellularity with and without 5-FU treatment. MNCs were harvested from the spleen tissues without enzymatic treatment, and viable cell counts were taken after RBC lysis using a Neubauer chamber (n = 5–6). (B) Comparison of total LT-HSC and ST-HSC in spleen tissues treated with and without 5-FU. Flow cytometry analysis was performed to identify and examine LT-HSC (Lin-CD41-CD48-Sca-1+c-kit+CD150+ cells) and ST-HSC (Lin-CD41-CD48-Sca-1+c-kit+CD150- cells) populations in splenic MNCs harvested from control and 5-FU treated mice (n = 4–6). (C) Euclidean distances calculated for each pHSC with reference to pseudo-surfaces of capsular myofibroblasts in the spleen tissues harvested from male and female mice after 5-FU treatment. Each dot represents a pHSC immunolocalized as a 3-c-kit+CD150+ cell by confocal imaging (n = 2, N; male = 327, female = 333; each dot represents a pHSCs). (D) Euclidean distances were calculated for each HSPC with reference to nearest capsular surface in the spleen with or without 5-FU treatment. Each dot represents a HSPC immunolocalized as a 3-c-kit+ cell by confocal imaging (n = 4–6, N; Control = 836, 5-FU = 796 HSPCs). (E) Distribution frequency of HSPCs at sequential distance intervals relative to capsular surface in the spleen tissues with or without 5-FU treatment (n = 4–6, N; Control = 836, 5-FU = 796 HSPCs). (F) Comparison of Euclidean distances for Ki-67- and Ki-67+ pHSCs relative to the nearest capsular surface detected in spleen sections from 5-FU treated mice (n = 4, N; Ki-67- = 243, Ki-67+ = 417 pHSCs). (G) Comparison between Ki-67- and Ki-67+ pHSCs for their distribution frequency within sequential distance intervals relative to capsular surface in the spleen tissues after 5-FU treatment (n = 4, N; Ki-67- = 243, Ki-67+ = 417 pHSCs). (H) Comparison of Euclidean distances for Ki-67- and Ki-67+ HSPCs relative to the nearest α-SMA+ myofibroblastic capsular surfaces in spleen sections from 5-FU treated mice (n = 4, N; Ki-67- = 300, Ki-67+ = 496 HSPCs). (I) Comparison between Ki-67- and Ki-67+ HSPCs for their distribution frequency within sequential distance intervals relative to capsular surface in the spleen tissues after 5-FU treatment (n = 4, N; Ki-67- = 300, Ki-67+ = 496 HSPCs). (J) Euclidean distances were calculated for each Ki-67+ pHSC with reference to nearest capsular surface in the spleen with or without 5-FU treatment. Each dot represents a Ki-67+ pHSC immunolocalized by confocal imaging (n = 4–6, N; Control = 406, 5-FU = 417 Ki-67+ pHSCs). (K) Distribution frequency of Ki-67+ pHSCs at sequential distance intervals relative to capsular myofibroblastic surface in the spleen tissues with or without 5-FU treatment (n = 4–6, N; Control = 406, 5-FU = 417 Ki-67+ pHSCs). (L) Comparison of Euclidean distances for Ki-67- pHSCs relative to the nearest capsular surfaces detected in spleen sections from control and 5-FU treated mice (n = 4–6, N; Control = 301, 5-FU = 243 Ki-67- pHSCs). (M) Comparison of Ki-67- pHSCs for their distribution frequency within sequential distance intervals relative to capsular surface in the spleen tissues with and without 5-FU treatment (n = 4–6, N; Control = 301, 5-FU = 243 Ki-67- pHSCs). (N) Euclidean distances calculated for Ki-67+ HSPCs relative to the nearest observable capsular myofibroblastic surface of spleen tissues from control and 5-FU treated mice (n = 4–6, N; Control = 466, 5-FU = 496 Ki-67+ HSPCs). (O) Distribution of Ki-67+ HSPCs at sequential distance intervals relative to capsular surface in the spleen tissues with or without 5-FU treatment (n = 4–6, N; Control = 466, 5-FU = 496 Ki-67+ HSPCs). (P) Euclidean distances calculated for Ki-67- HSPCs relative to the capsular surfaces of spleen tissues treated with or without 5-FU (n = 4–6, N; Control = 370, 5-FU = 300 Ki-67- HSPCs). (Q) Distribution frequency of Ki-67- HSPCs at different distance intervals relative to capsular surface in the spleen tissues with or without 5-FU treatment (n = 4–6, N; Control = 370, 5-FU = 300 Ki-67- HSPCs). Data is presented as bar graph (mean ± SEM) in panels (E, G, I, K, M, O, Q) or box-whiskers plot (median with min to max) in panels (AD, F, H, J, L, N, P). The p-value in figures (AQ) were calculated by the Student’s t-test, *p < 0.05, **p < 0.01, ***p < 0.001, ****p < 0.0001, and ns p > 0.05.
Figure EV5
Figure EV5. Global proteome-based interactions show HSPC interactions preferential to myofibroblastic cells.
(A) Volcano plot showing proteins differentially enriched between LSK versus CTM populations. Log2 fold change and −log10 adjusted p-values are plotted on the x and y axes, respectively. Represented data are based on six independent biological replicates (n = 6), each with three technical replicates (N = 18). Cyan dots represent proteins with statistically significant (adjusted p-value < 0.05) higher abundance of >2 fold change. Red dots represent proteins having statistically significant (adjusted p-value < 0.05) lower abundance with >2 fold change. (B) Volcano plot showing differentially enriched proteins between LSK versus STC populations (n = 6, N = 18). (C) Heatmap analysis of differentially enriched secretory proteins in CTMs compared to STCs. The analysis was performed on the secretory proteins with differential enrichment with the adjusted p-values of <0.05 and fold change > 2.0. (D) Reactome pathway analysis of differentially enriched pathways based on proteins upregulated with fold change > 2.0 and adjusted p-value < 0.05. Significantly (p-value < 0.05) up-regulated pathways in CTMs versus STCs are illustrated. (E) Reactome pathway analysis was performed on proteins upregulated with fold change > 2.0 and adjusted p-value < 0.05. Differentially enriched pathways significantly (p-value < 0.05) up-regulated in STCs compared to CTMs are illustrated. (F) Heatmap analysis of differentially enriched secretory ECM proteins. Secretory ECM proteins with significantly (adjusted p-value < 0.05) altered enrichment (fold change > 2.0) between CTMs and STCs are illustrated. (G) Relative abundance of integrin sub-units enriched in LSKs, STCs, and CTMs. Represented data are based on six independent biological replicates (n = 6), each with three technical replicates (N = 18).

Similar articles

References

    1. Acar M, Kocherlakota KS, Murphy MM, Peyer JG, Oguro H, Inra CN, Jaiyeola C, Zhao Z, Luby-Phelps K, Morrison SJ (2015) Deep imaging of bone marrow shows non-dividing stem cells are mainly perisinusoidal. Nature 526:126–130 - PMC - PubMed
    1. Asada N, Kunisaki Y, Pierce H, Wang Z, Fernandez NF, Birbrair A, Ma’ayan A, Frenette PS (2017) Differential cytokine contributions of perivascular haematopoietic stem cell niches. Nat Cell Biol 19:214–223 - PMC - PubMed
    1. Baldridge MT, King KY, Boles NC, Weksberg DC, Goodell MA (2010) Quiescent haematopoietic stem cells are activated by IFN-γ in response to chronic infection. Nature 465:793–797 - PMC - PubMed
    1. Bennett M, Pinkerton PH, Cudkowicz G, Bannerman RM (1968) Hemopoietic progenitor cells in marrow and spleen of mice with hereditary iron deficiency anemia. Blood 32:908–921 - PubMed
    1. Biswas A, Singh SK, Kartha GM, Khurana S (2022) Immuno-localization of definitive hematopoietic stem cells in the vascular niche of mouse fetal liver. STAR Protoc 3:101580 - PMC - PubMed

LinkOut - more resources