

Research on ischemic stroke risk assessment based on CTA radiomics and machine learning
- PMID: 40474055
- PMCID: PMC12142908
- DOI: 10.1186/s12880-025-01697-y
Research on ischemic stroke risk assessment based on CTA radiomics and machine learning
Abstract
Background: The study explores the value of a model constructed by integrating CTA-based carotid plaque radiomic features, clinical risk factors, and plaque imaging characteristics for prognosticating the risk of ischemic stroke.
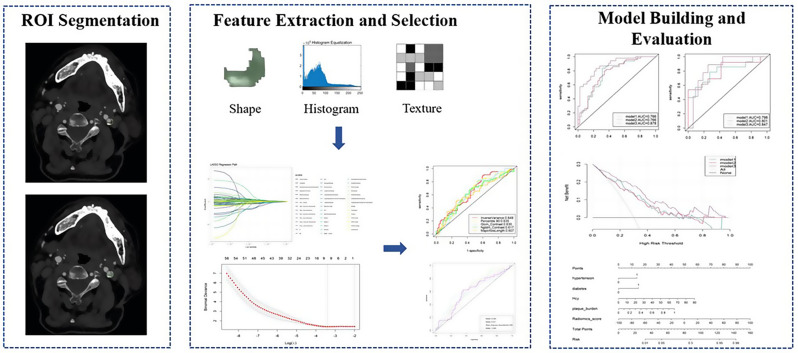
Methods: Data from 123 patients with carotid atherosclerosis were analyzed and divided into stroke and asymptomatic groups based on DWI findings. Clinical information was collected, and plaque imaging characteristics were assessed to construct a traditional model. Radiomic features of carotid plaques were extracted using 3D-Slicer software to build a radiomics model. Logistic regression was applied in the training set to establish the traditional model, the radiomics model, and a combined model, which were then tested in the validation set. The prognostic ability of the three models for ischemic stroke was evaluated using ROC curves, while calibration curves, decision curve analysis, and clinical impact curves were used to assess the clinical utility of the models. Differences in AUC values between models were compared using the DeLong test.
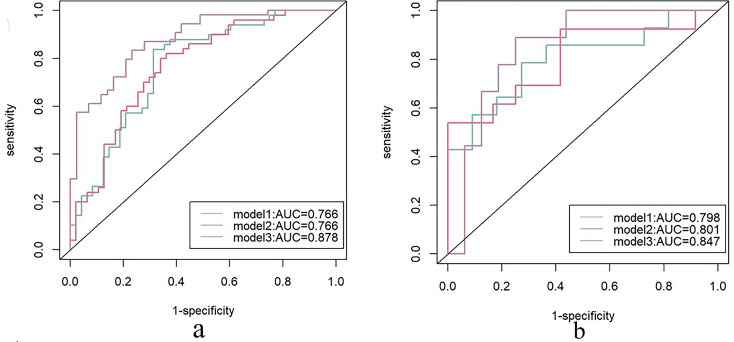
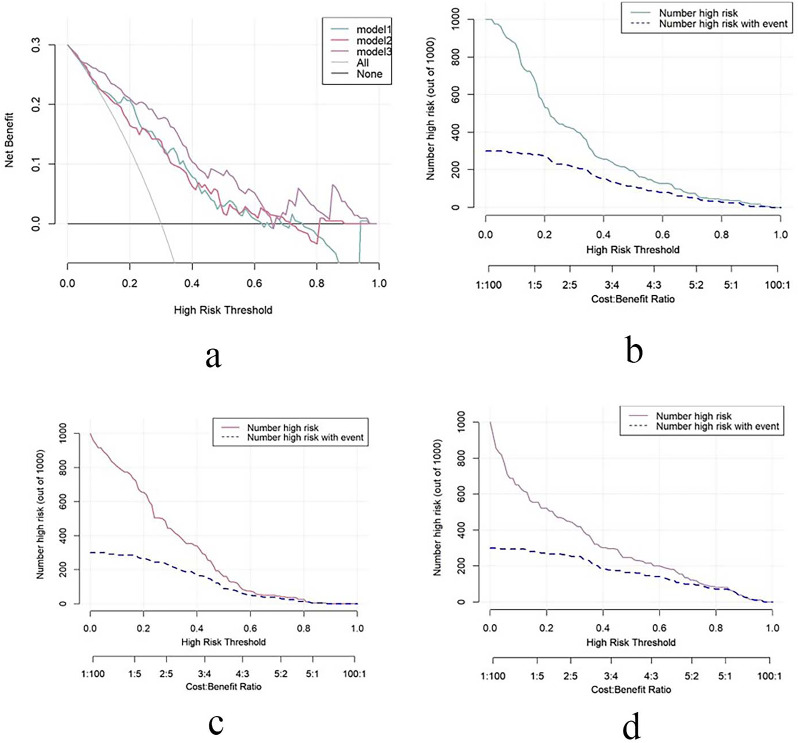
Results: Hypertension, diabetes, elevated homocysteine (Hcy) concentrations, and plaque burden are independent risk factors for ischemic stroke and were used to establish the traditional model. Through Lasso regression, nine optimal features were selected to construct the radiomics model. ROC curve analysis showed that the AUC values of the three Logistic regression models were 0.766, 0.766, and 0.878 in the training set, and 0.798, 0.801, and 0.847 in the validation set. Calibration curves and decision curve analysis showed that the radiomics model and the combined model had higher accuracy and better fit in prognosticating the risk of ischemic stroke.
Conclusions: The radiomics model is slightly better than the traditional model in evaluating the risk of ischemic stroke, while the combined model has the best prognostic performance.
Keywords: Carotid vulnerable plaque; Computed tomography angiography; Ischemic stroke; Nomogram; Radiomics.
© 2025. The Author(s).
Conflict of interest statement
Declarations. Ethics approval and consent to participate: We confirm that the study was conducted in accordance with relevant guidelines and regulations. This study was approved by the Medical Ethics Committee of the Second Affiliated Hospital of Kunming Medical University, with a waiver of informed consent for participants [Ethics approval reference number: Review-PJ-Science-2024-51]. Consent for publication: Not applicable. Competing interests: The authors declare no competing interests.
Figures


References
-
- Prevention ROS, Group T I C W. Summary of the < china stroke prevention and treatment report 2021> . Chin J Cerebrovasc Dis. 2023;20(11):783–93.
MeSH terms
Grants and funding
LinkOut - more resources
Full Text Sources
Medical
