

Molecular markers of reduced behavioral sensitivity to transfluthrin in Anopheles gambiae s.s. from Western Kenya
- PMID: 40474067
- PMCID: PMC12142849
- DOI: 10.1186/s12864-025-11755-y
Molecular markers of reduced behavioral sensitivity to transfluthrin in Anopheles gambiae s.s. from Western Kenya
Abstract
Background: The emergence and spread of insecticide resistance in malaria vectors threatens vector control efforts. The use of spatial repellent products (SR) containing volatile insecticides such as transfluthrin offer a promising complementary strategy to current vector control tools. Here, we employed whole transcriptome analysis to investigate the molecular mechanisms underlying reduced behavioral sensitivity to transfluthrin in two pyrethroid-resistant populations of Anopheles gambiae s.s. Using a high-throughput screening system (HITSS), we evaluated 600 mosquitoes across three populations (Bungoma field population, the insecticide-resistant Pimperena lab strain, and the susceptible Kisumu lab strain), categorizing them as responders or non-responders based on their SR avoidance behavior. Non-responders exhibited significantly reduced repellency (spatial activity index < 0.1) at standard transfluthrin concentrations (0.0025 μg/ml).
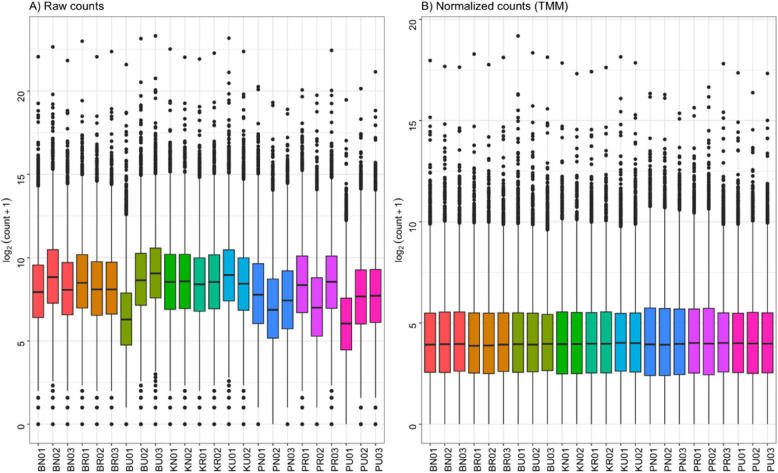
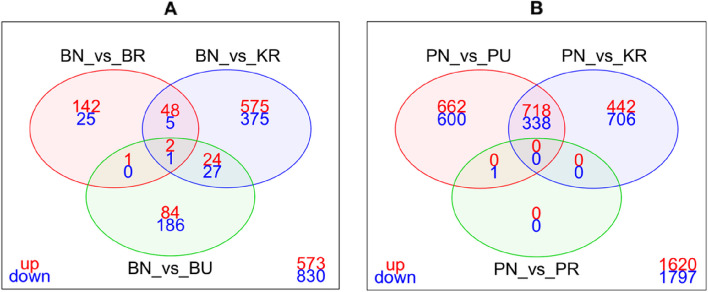
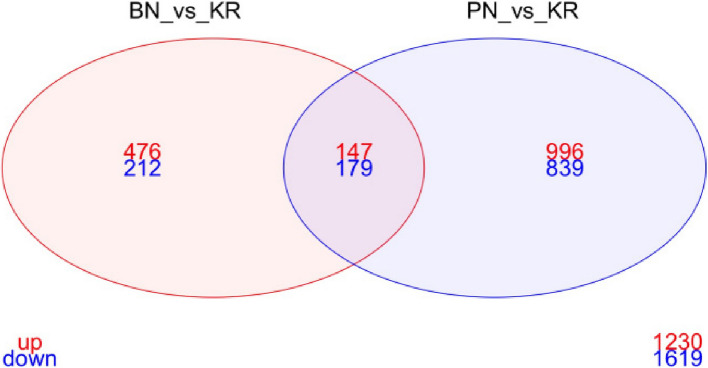
Results: RNA sequencing of pooled samples (n = 10 mosquitoes per pool, three replicates per condition) revealed distinct transcriptional profiles between responders and non-responders. The cytochrome P450 gene CYP12F12 showed significant overexpression (FC = 36.6389, p < 0.001) in Bungoma non-responders, suggesting its potential role in transfluthrin metabolism. Additionally, we observed population-specific distributions of voltage-gated sodium channel mutations, with fixation of kdr L995F in Pimperena non-responders and elevated frequency (80-100%) of kdr L995S in Bungoma non-responders.
Conclusions: These findings provide the first molecular evidence linking both metabolic and target-site mechanisms to reduced behavioral sensitivity to transfluthrin in malaria vectors. The co-occurrence of CYP12F12 overexpression and kdr mutations suggests multiple resistance mechanisms may affect spatial repellent efficacy, highlighting the need for resistance monitoring in spatial repellent deployment strategies.
Keywords: An. gambiae s.s; kdr mutation; CYP12 F12; Insecticide resistance; RNA-seq; Spatial repellents; Transfluthrin.
© 2025. The Author(s).
Conflict of interest statement
Declarations. Ethics approval and consent to participate: This study received ethical approval from the Kenya Medical Research Institute—Scientific and involve human subjects (SERU 3309). The study protocol was reviewed by the US Centers for Disease Control and Prevention (CDC). Informed verbal consent was obtained from all participating household heads prior to adult mosquito collection. No monetary compensation was provided to participants. However, as part of a larger ongoing study with existing administrative approvals, these households were prioritized for the distribution of long-lasting insecticidal nets (LLINs) by the National Malaria Control Program (NMCP). At the time of sampling, National Commission for Science, Technology & Innovation (NACOSTI) approval was not a mandatory requirement. Consent for publication: This manuscript has been published with the permission of the Kenya Medical Research Institute (KEMRI) Director General. Competing interests: SO is at the time of this submission employed at Vestergaard Sarl, a company that manufacture’s vector control products, LLINs, not evaluated in this study. All other the authors declared that they have no competing interests.
Figures


References
-
- World malaria report 2024. https://www.who.int/teams/global-malaria-programme/reports/world-malaria....
-
- World malaria report 2023. World malaria report 2023. https://www.who.int/publications-detail-redirect/9789240086173.
MeSH terms
Substances
Grants and funding
LinkOut - more resources
Full Text Sources
Research Materials
Miscellaneous
