. 2025 Jun 5;26(1):563.
doi: 10.1186/s12864-025-11745-0.

Mutual suppression between mutations in the Dictyostelium Greenbeard pathway restores wild-type development

Affiliations

Mutual suppression between mutations in the Dictyostelium Greenbeard pathway restores wild-type development

Mariko Katoh-Kurasawa et al. BMC Genomics. .

Abstract

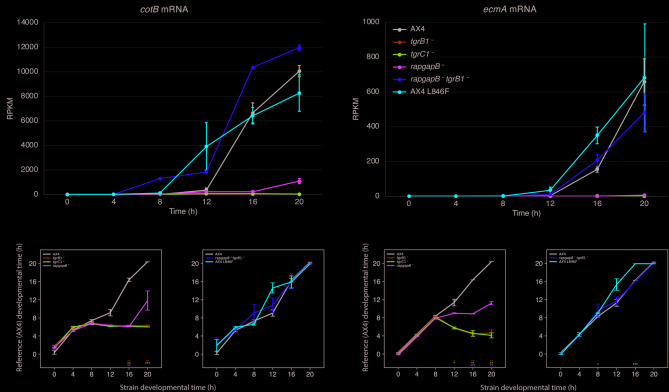
Background: The Dictyostelium greenbeard pathway is mediated by two polymorphic transmembrane proteins, the TgrC1 ligand and the TgrB1 receptor. These proteins mediate allorecognition, altruism, and the developmental transition to multicellularity. A genetic suppressor screen revealed activating mutations in tgrB1 and inactivating mutations in rapgapB, a regulator of the GTPase protein RapA. Inactivation of either tgrB1, tgrC1, or rapgapB leads to developmental defects, but the respective double-mutant strains rapgapB-tgrB1- and rapgapB-tgrC1- develop well and produce spores. This mutual suppression could result from inducing an alternative pathway or from restoring wild-type development, but morphological analyses alone could not resolve this question.

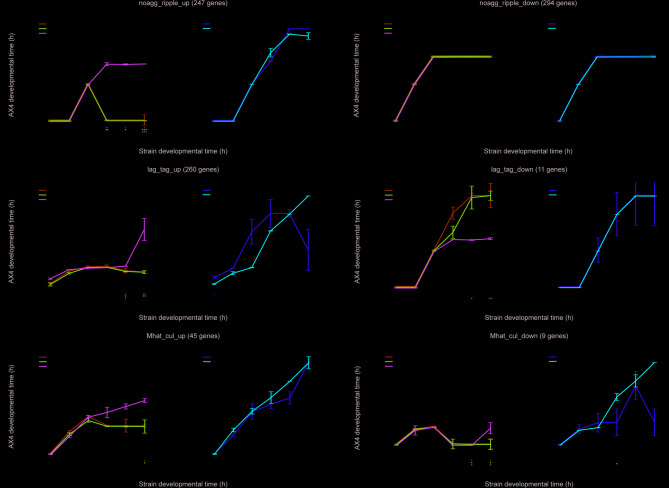
Results: Here, we show that the mutual suppression between rapgapB- and tgrB1- restores wild-type development. We also analyzed an activated tgrB1 allele in the wild-type background and found evidence for interactions between the wild-type and the activated alleles. Using RNA-sequencing analyses, we compared the transcriptomes of the wild type to those of several mutant strains and found that the single-gene mutations attenuated transcriptome progression over developmental time, whereas the double-gene mutation strain rapgapB-tgrB1- and the activated tgrB1 mutation exhibited near wild-type transcriptomes. Our findings suggest that tgrB1, tgrC1, and rapgapB are involved in a pathway in which rapgapB negatively regulates tgrB1 and tgrC1 expression, whereas tgrB1 and tgrC1 positively regulate rapgapB expression.

Conclusions: These findings suggest that the Dictyostelium greenbeard pathway interfaces with the central RapGAPB-RapA regulatory pathway, providing molecular insight into a mutual suppression mechanism in which two deleterious mutations restore wild-type behavior.

Keywords: Dictyostelium allorecognition; Dictyostelium development; Greenbeard pathway; Mutual suppression; Transcriptome phenotyping.


Conflict of interest statement

Declarations. Ethics approval and consent to participate: Not applicable. Consent for publication: Not applicable. Competing interests: The authors declare no competing interests.

Figures

Fig. 1
Fig. 1
A feedback loop controls the mRNA abundance of tgrB1, tgrC1 and rapgapB. We traced the mRNA abundance of three transcripts, tgrB1, tgrC1 and rapgapB, in the developmental time courses of six strains as indicated in the legend. AX4 is the wild type; tgrB1, tgrC1, and rapgapB are knockout strains for the respective single genes; rapgapBtgrB1 is a strain in which the respective two genes were knocked out; AX4 L846F is a wild-type strain that carries an additional allele of activated tgrB1L846F. (a) A schematic description of the transcriptional feedback loop where arrowheads indicate positive regulation and barred lines indicate negative regulation after eight hours of development. The dashed lines indicate that the regulatory relationships are indirect. (b) The mRNA abundance of rapgapB; (c) The mRNA abundance of tgrB1; (d) The mRNA abundance of tgrC1. In b, c, and d, the x-axis depicts developmental time (hours) and the y-axis depicts mRNA abundance in Reads Per Kilobase per Million (RPKM). Note that the y-axis in b is different from the y-axes in c and d. Each point represents the mean of three independent replications and the error bars represent the standard error of the mean
Fig. 2
Fig. 2
Comparison between the strains over the entire transcriptome. We compared the transcriptomes of six strains using an MDS-like method. The black line in both panels represents the wild type (AX4) and the colored lines represent the mutant strains. tgrB1, tgrC1, and rapgapB are knockout strains for the respective single genes. rapgapBtgrB1 is a strain in which the respective two genes were knocked out. AX4 L846F is a wild-type strain that carries an additional allele of activated tgrB1L846F. In both panels, the x-axis represents the developmental time (hours) of the listed strain and the y-axis represents the developmental time (hours) of the wild-type reference strain (AX4). Colored lines above and to the left of the black line represent precocious developmental progression. Colored lines below and to the right represent attenuated developmental progression. (a) Comparison of the three single-mutant strains tgrB1, tgrC1, and rapgapB to the wild type. (b) Comparison of the other strains to the wild type. Each time point on the graph represents the mean of three independent replications and the error bars represent the respective standard errors of the mean. Statistical significance between each strain and AX4 was assessed at each time point using a two-sample t-test. P-values were adjusted using the Benjamini-Hochberg correction to account for multiple comparisons. Asterisks at the bottom of the plot indicate significant differences: * for p < 0.05, ** for p < 0.01, and *** for p < 0.001. The calculated p-values for all the instances are provided in Additional File 6. The separation of (a) and (b) has no functional significance. It was done to simplify the visualization
Fig. 3
Fig. 3
Comparison between the strains over selected milestone genes. We compared the six strains using an MDS-like method with three milestone gene groups. The black line represents the wild type (AX4) and the colored lines represent the mutant strains. tgrB1, tgrC1, and rapgapB are knockout strains for the respective single genes. rapgapBtgrB1 is a strain in which the respective two genes were knocked out. AX4 L846F is a wild-type strain that carries an additional allele of activated tgrB1L846F. The x-axis represents the developmental time (hours) of the listed strain and the y-axis represents the developmental time (hours) of the wild-type reference strain (AX4). Colored lines above and to the left of the black line represent precocious developmental progression. Colored lines below and to the right represent attenuated developmental progression. The first two panels in each row represent genes that are up-regulated during the milestone transition and the next two panels represent genes that are down-regulated during the milestone transition. (a) The milestone group represents the no-aggregation to ripples transition (noagg_ripple). The upregulated group (_up) consists of 247 genes and the downregulated group (_down) consists of 294 genes. (b) The milestone group represents the loose-aggregate to tight-aggregate transition (lag_tag). The upregulated group (_up) consists of 260 genes and the downregulated group (_down) consists of 11 genes. (c) The milestone group represents the Mexican hat to culmination transition (Mhat_cul). The upregulated group (_up) consists of 45 genes and the downregulated group (_down) consists of 9 genes. All eight milestone-based comparisons, including the above groups as well as information about the average developmental trajectory of the respective genes, are described in Fig. S4. Each time point on the graph represents the mean of three independent replications and the error bars represent the respective standard errors of the mean. Statistical significance between each strain and AX4 was assessed at each time point using a two-sample t-test. P-values were adjusted using the Benjamini-Hochberg correction to account for multiple comparisons. Asterisks at the bottom of the plot indicate significant differences: * for p < 0.05, ** for p < 0.01, and *** for p < 0.001. The calculated p-values for all the instances are provided in Additional File 6. The separation between the left and right panels in each section has no functional significance. It was done to simplify the visualization
Fig. 4
Fig. 4
Comparison between the strains over cell-type specific genes. We traced the mRNA abundance of two transcripts, the prespore gene cotB (a), and the prestalk gene ecmA (b), in the developmental time courses of six strains as indicated in the legend. The mRNA abundance (RPKM, y-axis) is plotted as a function of developmental time (hours, x-axis). AX4 is the wild type; tgrB1, tgrC1, and rapgapB are knockout strains for the respective single genes; rapgapBtgrB1 is a strain in which the respective two genes were knocked out; AX4 L846F is a wild-type strain that carries an additional allele of activated tgrB1L846F. Each point in all panels represents the mean of three independent replications and the error bars represent the standard errors of the mean. We also compared the six strains using an MDS-like method with two cell-type specific gene groups (c and d). The black line in all panels represents the wild type (AX4) and the colored lines represent the mutant strains. tgrB1, tgrC1, and rapgapB are knockout strains for the respective single genes. rapgapBtgrB1 is a strain in which the respective two genes were knocked out. AX4 L846F is a wild-type strain that carries an additional allele of activated tgrB1L846F. In the two panels, the x-axis represents the developmental time (hours) of the listed strain and the y-axis represents the developmental time (hours) of the wild-type reference strain (AX4). Colored lines above and to the left of the black line represent precocious developmental progression. Colored lines below and to the right represent attenuated developmental progression. c. The prespore-specific gene group consists of 48 genes. d. The prestalk-specific gene group consists of 87 genes. Statistical significance between each strain and AX4 was assessed at each time point using a two-sample t-test. P-values were adjusted using the Benjamini-Hochberg correction to account for multiple comparisons. Asterisks at the bottom of the plot indicate significant differences: * for p < 0.05, ** for p < 0.01, and *** for p < 0.001. The calculated p-values for all the instances are provided in Additional File 6. The separation of the mutants into two panels in c and d has no functional significance. It was done to simplify the visualization
Fig. 5
Fig. 5
Differentially expressed genes and networks. We compared the transcriptomes of the six strains to one another and performed differential gene expression analysis using a significance threshold of p < 0.0001. In the Venn diagram (a), each circle represents a strain and the overlapping regions represent genes that are not differentially expressed. The strain names are indicated in colored text next to the respective circles and the number of genes in selected sections is indicated in black text. The bar graph (b) shows the number of genes in the respective intersections, the number above each bar indicates the number of commonly (non-differentially) expressed genes, and the dot-and-line chart below each bar indicates which overlapping strains refer to the respective bar (black dots and solid line connectors represent included strains; grey dots represent excluded strains). For example, the third bar represents 424 genes that were commonly expressed in the AX4, rapgapBtgrB1, and AX4 tgrB1L846F strains (black dots) and different from the tgrB1 and tgrC1 strains. We then used the differential expression data to compare the wild type AX4 to two single-mutation strains, tgrB1 (c) and rapgapB (d), and to the respective double mutant rapgapBtgrB1 (e). We used the differentially expressed genes to perform gene-set enrichment analysis using the dictyBase mutant phenotype category to identify common annotations among the differentially expressed genes. We performed network analysis to view the annotations of the top 100 gene groups and generated a narrative using an artificial intelligence tool. Each node in the network represents a group of genes with a common annotation and the lengths of the arcs are directly proportional to the distance between the nodes. The colored nodes highlight the most significant clusters and the colored text is the respective AI-derived narrative. There is no relationship between the colors in the different subpanels. The respective data are provided in Additional File 4. The data shown in panels c, d, and e are also shown in Fig. S5 in the context of other mutant strains

Similar articles

References

    1. Kessin RH. Dictyostelium - Evolution, cell biology, and the development of multicellularity. Cambridge, UK: Cambridge Univ. Press; 2001.
    1. Strassmann JE, Gilbert OM, Queller DC. Kin discrimination and Cooperation in microbes. Annu Rev Microbiol. 2011;65:349–67. - PubMed
    1. Shaulsky G, Kessin RH. The cold war of the social amoebae. Curr Biology: CB. 2007;17(16):R684–692. - PubMed
    1. Kundert P, Shaulsky G. Cellular allorecognition and its roles in Dictyostelium development and social evolution. Int J Dev Biol. 2019;63(8–9–10):383–93. - PMC - PubMed
    1. Benabentos R, Hirose S, Sucgang R, Curk T, Katoh M, Ostrowski EA, Strassmann JE, Queller DC, Zupan B, Shaulsky G, et al. Polymorphic members of the lag gene family mediate kin discrimination in Dictyostelium. Curr Biology: CB. 2009;19(7):567–72. - PMC - PubMed

MeSH terms

Substances

LinkOut - more resources