

Genome-wide identification and expression analysis of the ferritin family in sweetpotato and its two diploid relatives
- PMID: 40474077
- PMCID: PMC12139147
- DOI: 10.1186/s12870-025-06732-2
Genome-wide identification and expression analysis of the ferritin family in sweetpotato and its two diploid relatives
Abstract
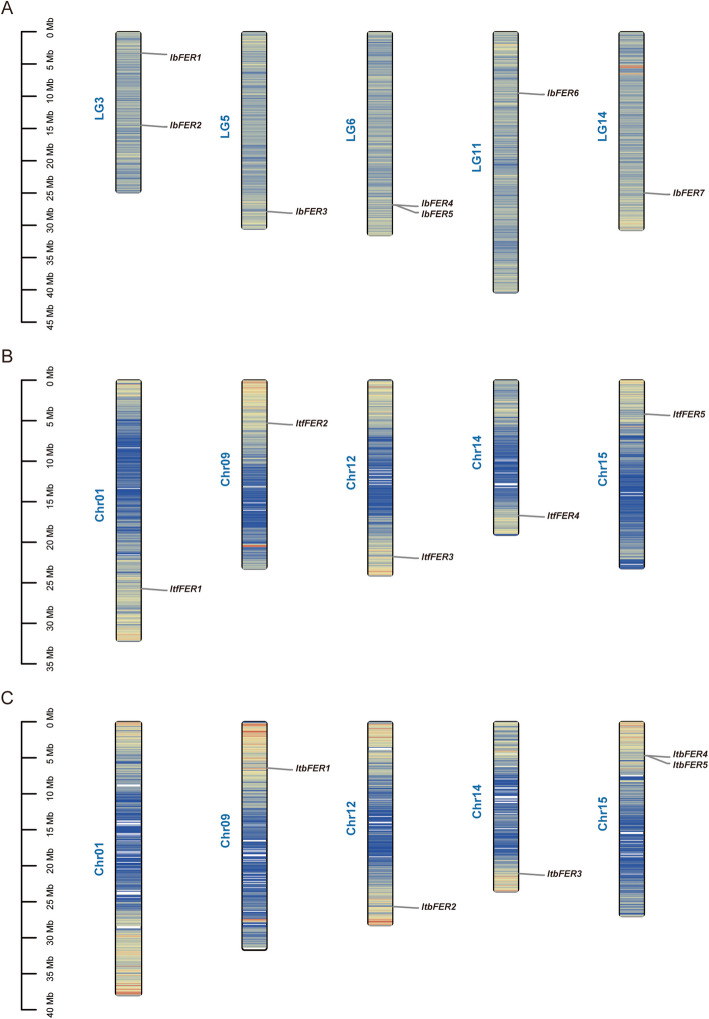
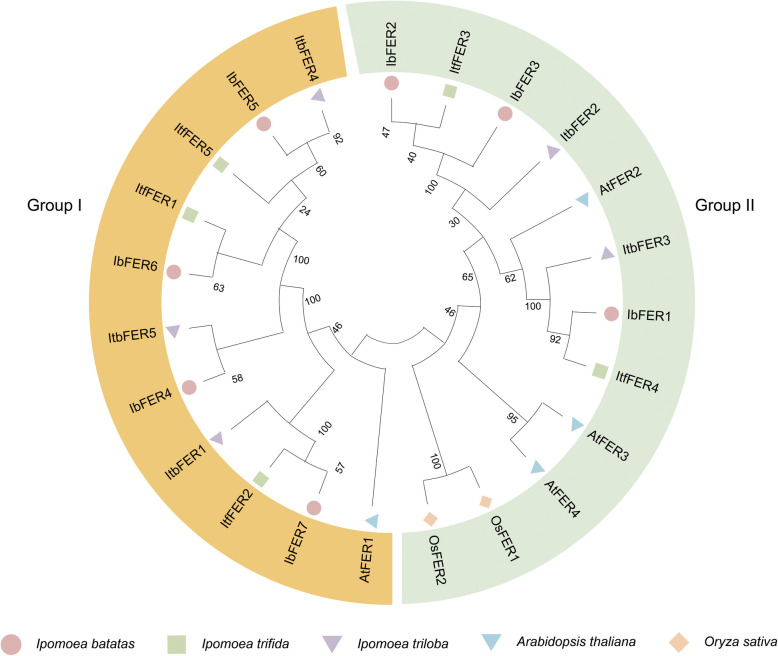
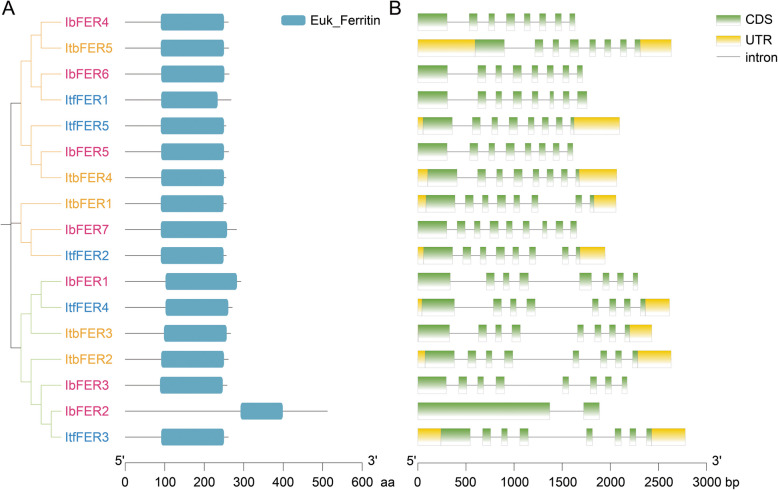
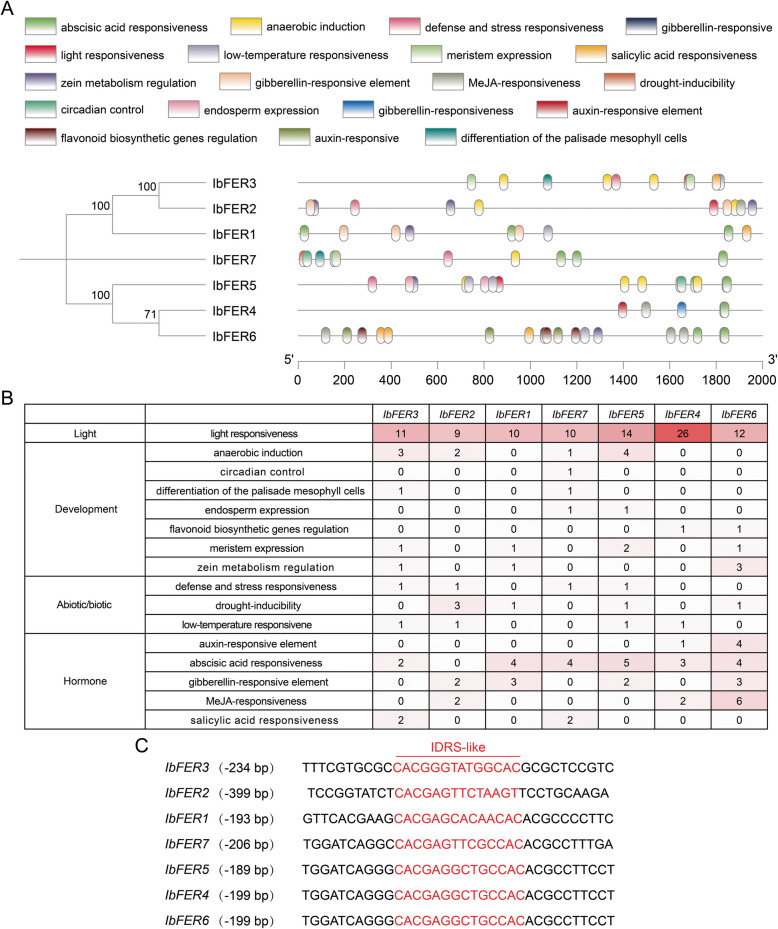
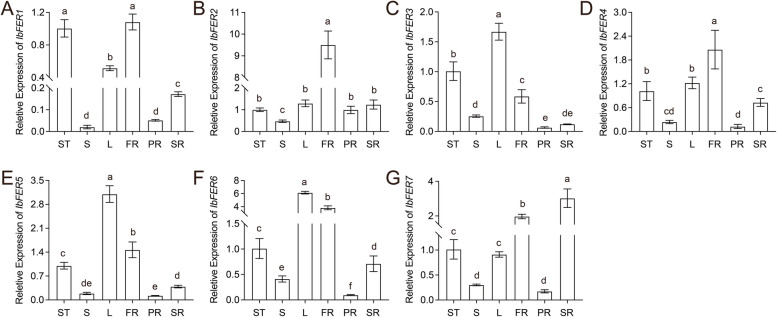
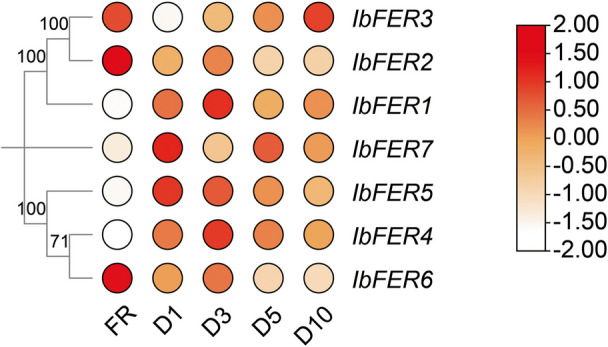
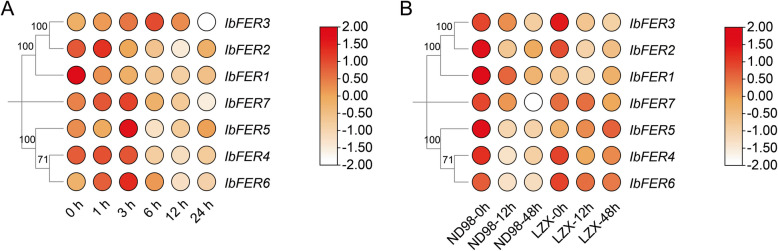
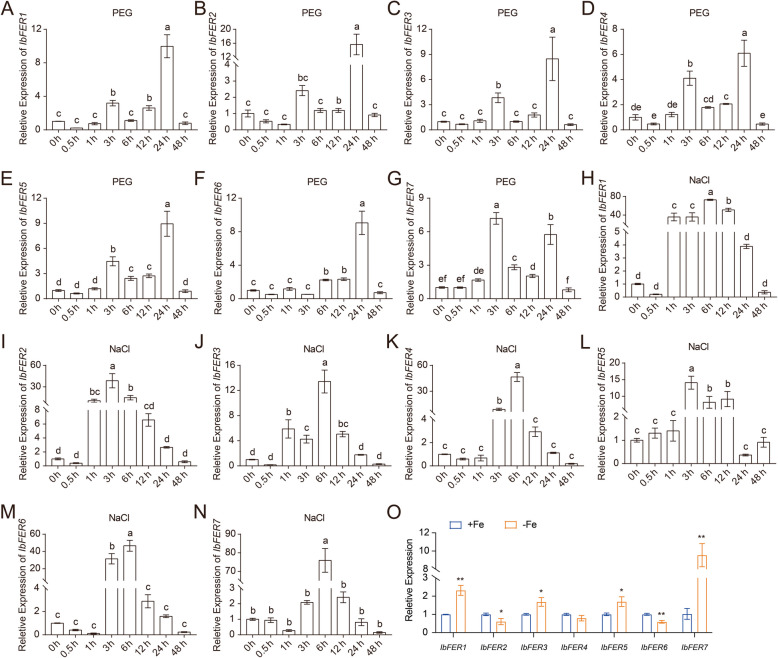
Ferritin (FER), a type of iron-storing proteins, play an essential role in iron storage and in protection against oxidative stress. However, there is limited detailed information regarding FERs in sweetpotato. In this study, a total of 17 putative FER genes, 7, 5 and 5 FERs in sweetpotato (I. batatas, 2n = 6x = 90) and its two diploid relatives I. trifida (2n = 2x = 30) and I. triloba (2n = 2x = 30), located on chromosomes were identified. Phylogenetic analysis revealed that these genes are divided into two different groups. Promoter analysis revealed that IbFER promoters contained a number of abiotic/biotic stress-responsive elements, hormone-responsive element, and iron-dependent regulatory sequence. The structural motif analysis of FER proteins showed that Euk_Ferritin domain was identified near the C-terminus and the structures were relatively conserved in sweetpotato and its two diploid relatives. Transcriptome and RT-qPCR analysis demonstrated that the expression of FERs were detected in different tissues and showed tissue specificity, and they responded to abiotic stresses, such as drought, salt and Fe deficiency. Our results provide a theoretical basis for future genetic research, development of breeding strategies against abiotic stresses and food enrichment with iron in sweetpotato.
Keywords: FER; I. trifida; I. triloba; Abiotic stress; Sweetpotato; Tissue-specific expression.
© 2025. The Author(s).
Conflict of interest statement
Declarations. Ethics approval and consent to participate: Not applicable. Consent for publication: Not applicable. Competing interests: The authors declare no competing interests.
Figures
Similar articles
-
Genome-wide identification and expression analysis of the KNOX family and its diverse roles in response to growth and abiotic tolerance in sweet potato and its two diploid relatives.BMC Genomics. 2024 Jun 6;25(1):572. doi: 10.1186/s12864-024-10470-4. BMC Genomics. 2024. PMID: 38844832 Free PMC article.
-
Genome-Wide Identification of the A20/AN1 Zinc Finger Protein Family Genes in Ipomoea batatas and Its Two Relatives and Function Analysis of IbSAP16 in Salinity Tolerance.Int J Mol Sci. 2022 Sep 30;23(19):11551. doi: 10.3390/ijms231911551. Int J Mol Sci. 2022. PMID: 36232853 Free PMC article.
-
Genome-Wide Identification and Expression Analysis of SWEET Family Genes in Sweet Potato and Its Two Diploid Relatives.Int J Mol Sci. 2022 Dec 13;23(24):15848. doi: 10.3390/ijms232415848. Int J Mol Sci. 2022. PMID: 36555491 Free PMC article.
-
Genome-wide comparative analysis of the valine glutamine motif containing genes in four Ipomoea species.BMC Plant Biol. 2023 Apr 22;23(1):209. doi: 10.1186/s12870-023-04235-6. BMC Plant Biol. 2023. PMID: 37085761 Free PMC article.
-
Genome-Wide Identification and Expression Analysis of the Fructose-1,6-Bisphosphate Aldolase (FBA) Gene Family in Sweet Potato and Its Two Diploid Relatives.Int J Mol Sci. 2025 Jul 30;26(15):7348. doi: 10.3390/ijms26157348. Int J Mol Sci. 2025. PMID: 40806478 Free PMC article.
References
-
- Davila-Hicks P, Theil EC, Lönnerdal B. Iron in ferritin or in salts (ferrous sulfate) is equally bioavailable in nonanemic women. Am J Clin Nutr. 2004;80:936–40. 10.1093/ajcn/80.4.936. - PubMed
-
- Lindsay WL. 1995. Chemical reactions in soils that affect iron availability to plants. A quantative approach. Springer Netherlands. 10.1007/978-94-011-0503-3_2.
-
- WHO, 2016. Iron deficiency anaemia. http://www.who.int/nutrition/topics/ida/en/.
-
- Arosio P, Levi S. Ferritin, iron homeostasis, and oxidative damage. Free Radic Biol Med. 2002;33:457–63. 10.1016/s0891-5849(02)00842-0. - PubMed
-
- Liu X, Theil EC. Ferritins: dynamic management of biological iron and oxygen chemistry. Acc Chem Res. 2005;38:167–75. 10.1021/ar0302336. - PubMed
MeSH terms
Substances
Grants and funding
LinkOut - more resources
Full Text Sources
