

Genotype-by-environment interaction with high-dimensional environmental data: an example in pigs
- PMID: 40474090
- PMCID: PMC12142960
- DOI: 10.1186/s12711-025-00974-2
Genotype-by-environment interaction with high-dimensional environmental data: an example in pigs
Abstract
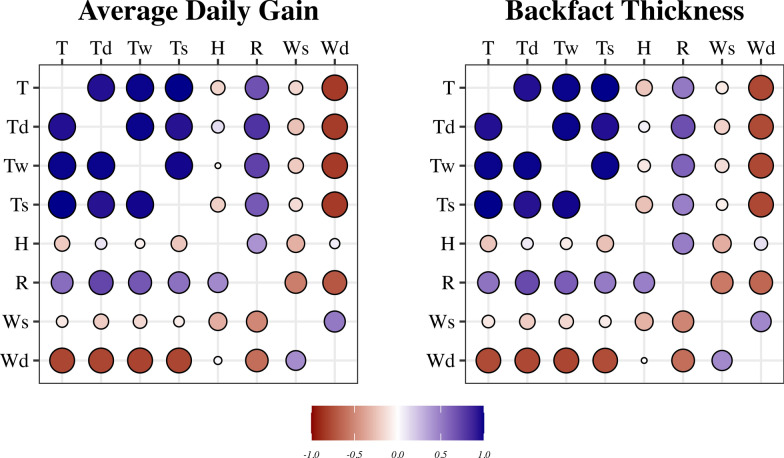
Background: In traditional genetic prediction models, environments are typically treated as uncorrelated effects, either fixed or random. Environments can be correlated when they share the same location, management practices, or climate conditions. The temperature-humidity index (THI) is often used to address environmental effects related to climate or heat stress. However, it does not fully describe the complete climate profile of a specific location. Therefore, it is more appropriate to use multiple environmental covariates (ECs), when available, to describe the weather in a specific environment. This raises the question of whether publicly available weather information (such as NASA POWER) is useful for genomic predictions. Genotype-by-environment interaction (GxE) can be modeled using multiple-trait models or reaction norms. However, the former requires a substantial number of records per environment, while the latter can result in over-parametrized models when the number of ECs is large. This study investigated whether using ECs is a suitable strategy to correlate environments (herds) and to model GxE in the genomic prediction of purebred pigs for production traits.
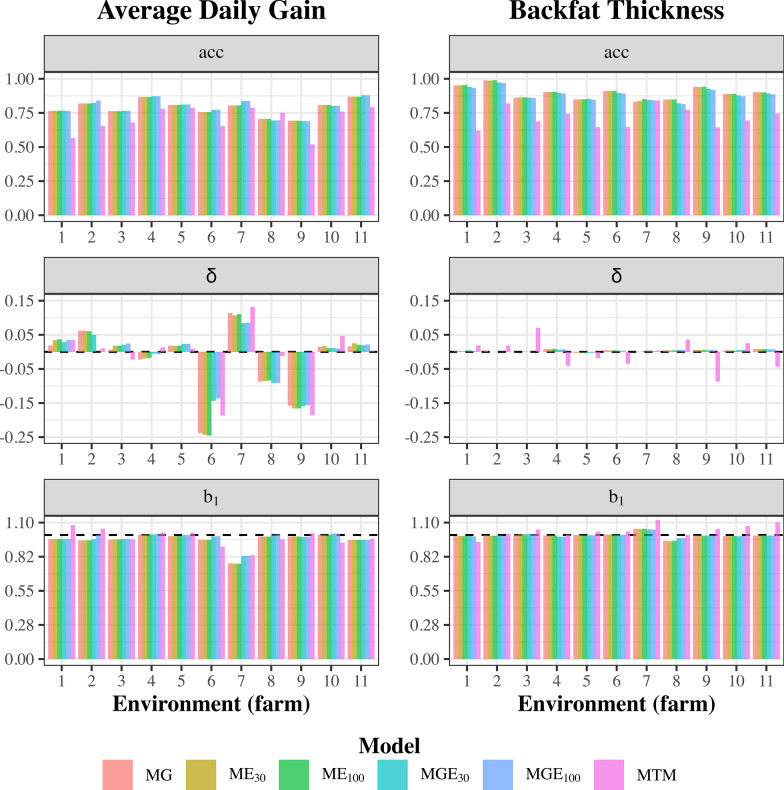
Results: We evaluated different models to account for environmental effects and GxE. When environments were correlated based on ECs, we observed an increase in environmental variance, which was accompanied by an increase in phenotypic variance and a decrease in heritability. Furthermore, including environments as an uncorrelated random effect yielded the same accuracy of estimated breeding values as treating them as correlated based on weather information. All the tested models exhibited the same bias, but the predictions from the multiple-trait models were under-dispersed. Evidence of GxE was observed for both traits; however, there were more genetically unconnected environments for backfat thickness than for average daily gain.
Conclusions: Using outdoor weather information to correlate environments and model GxE offers limited advantages for genomic predictions in pigs. Although it adds complexity to the model and increases computing time without improving accuracy, it does enhance model fit. Including environment information (e.g. herd effect) as an uncorrelated random effect in the model could help address GxE and environmental effects.
© 2025. The Author(s).
Conflict of interest statement
Declarations. Ethics approval and consent to participate: Data were obtained from existing databases; therefore, approval from the Animal Care and Use Committee was unnecessary for this study. Consent for publication: Not applicable. Competing interests: Ching-Yi Chen and Justin Holl are employees of the Pig Improvement Company. The authors declare no real or perceived conflicts of interest.
Figures


Similar articles
-
Prediction accuracies and genetic parameters for test-day traits from genomic and pedigree-based random regression models with or without heat stress interactions.J Dairy Sci. 2019 Jan;102(1):488-502. doi: 10.3168/jds.2018-15329. Epub 2018 Oct 19. J Dairy Sci. 2019. PMID: 30343923
-
Genomic predictions and GWAS for heat tolerance in pigs based on reaction norm models with performance records and data from public weather stations considering alternative temperature thresholds.J Anim Breed Genet. 2024 May;141(3):257-277. doi: 10.1111/jbg.12838. Epub 2023 Nov 27. J Anim Breed Genet. 2024. PMID: 38009390
-
Sire evaluation for total number born in pigs using a genomic reaction norms approach.J Anim Sci. 2014 Sep;92(9):3825-34. doi: 10.2527/jas.2013-6486. Epub 2014 Feb 3. J Anim Sci. 2014. PMID: 24492557
-
Investigating genotype by environment interaction for beef cattle fertility traits in commercial herds in northern Australia with multi-trait analysis.Genet Sel Evol. 2024 Oct 31;56(1):70. doi: 10.1186/s12711-024-00936-0. Genet Sel Evol. 2024. PMID: 39482597 Free PMC article.
-
A Review and Meta-Analysis of Genotype by Environment Interaction in Commercial Shrimp Breeding.Genes (Basel). 2024 Sep 18;15(9):1222. doi: 10.3390/genes15091222. Genes (Basel). 2024. PMID: 39336812 Free PMC article. Review.
References
-
- Makanjuola F, Rovere G, Cuyabano BCD, Lee SH, Gondro C. Including environmental variables in genomic models for carcass traits in Hanwoo beef cattle. In: Proceedings of the 12th world congress on genetics applied to livestock production: 3–8 July 2022: Rotterdam; 2022
-
- Fragomeni BO, Lourenco DA, Tsuruta S, Andonov S, Gray K, Huang Y, et al. Modeling response to heat stress in pigs from nucleus and commercial farms in different locations in the United States. J Anim Sci. 2016;94:4789–98. - PubMed
-
- Collier RJ, Gebremedhin KG. Thermal biology of domestic animals. Annu Rev Anim Biosci. 2015;3:513–32. - PubMed
-
- Ingram DL. Stimulation of cutaneous glands in the pig. J Comp Pathol. 1967;77:93–8. - PubMed
-
- Renaudeau D, Collin A, Yahav S, de Basilio V, Gourdine JL, Collier RJ. Adaptation to hot climate and strategies to alleviate heat stress in livestock production. Animal. 2012;6:707–28. - PubMed
MeSH terms
LinkOut - more resources
Full Text Sources
