

Diagnostic value of the Risk of Ovarian Malignancy Algorithm (ROMA) index in the detection of ovarian cancer in postmenopausal women: a systematic review and meta-analysis
- PMID: 40474158
- PMCID: PMC12142873
- DOI: 10.1186/s12905-025-03766-4
Diagnostic value of the Risk of Ovarian Malignancy Algorithm (ROMA) index in the detection of ovarian cancer in postmenopausal women: a systematic review and meta-analysis
Abstract
Objective: Given the significance of ovarian cancer and the importance of early diagnosis, this meta-analysis aimed to assess the diagnostic value of the ROMA index in predicting ovarian cancer in postmenopausal women.
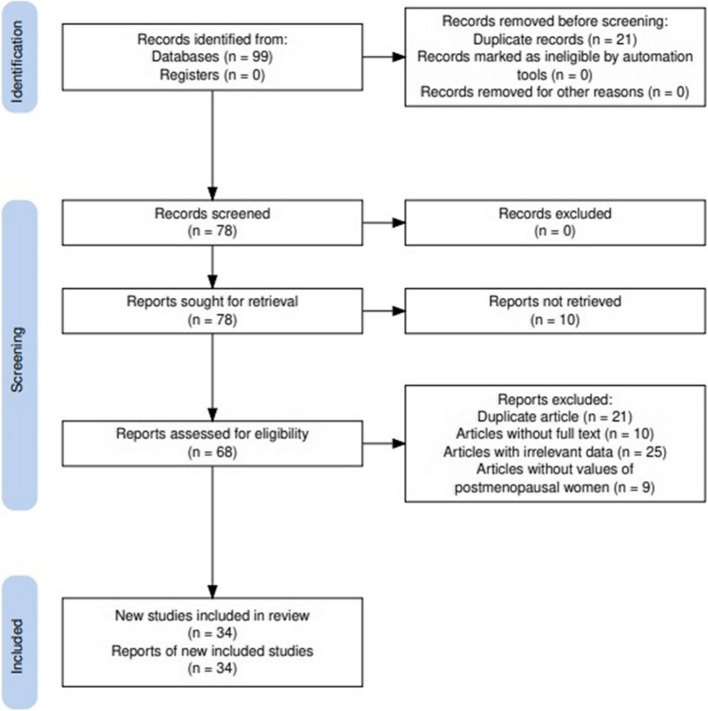
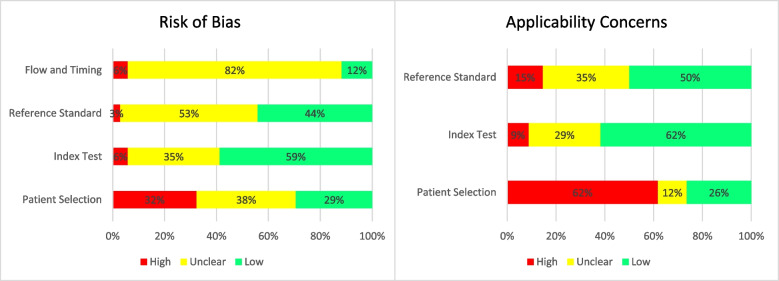
Methods: This systematic review and meta-analysis were conducted in accordance with the Preferred Reporting Items for Systematic Reviews and Meta-Analyses (PRISMA) guidelines. Relevant articles were retrieved from databases, including Web of Science, PubMed (MEDLINE), Google Scholar, Scopus, and Embase. The quality of the included studies was assessed using QUADAS-2. The GRADEPRO tool was used to evaluate and grade the quality of the evidence obtained from the meta-analysis. The diagnostic performance of the ROMA index in postmenopausal women was evaluated and comparisons were made using sensitivity, specificity, diagnostic odds ratio (DOR), positive likelihood ratio (LR +), negative likelihood ratio (LR-), and inverse negative likelihood ratio (1/LR-). Data were analyzed in STATA software using the "midas" and "metandi" commands.
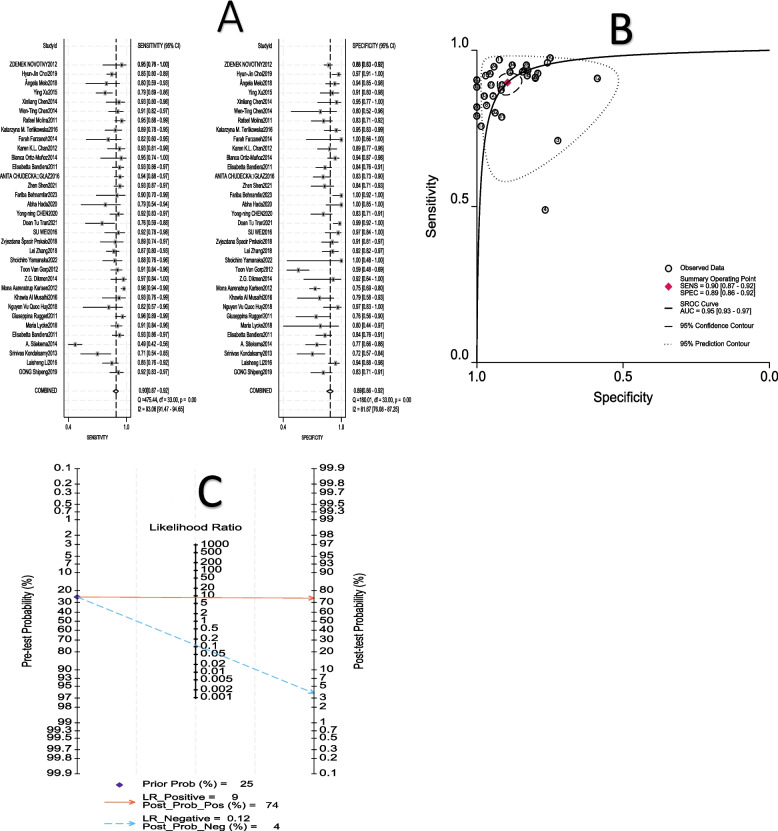
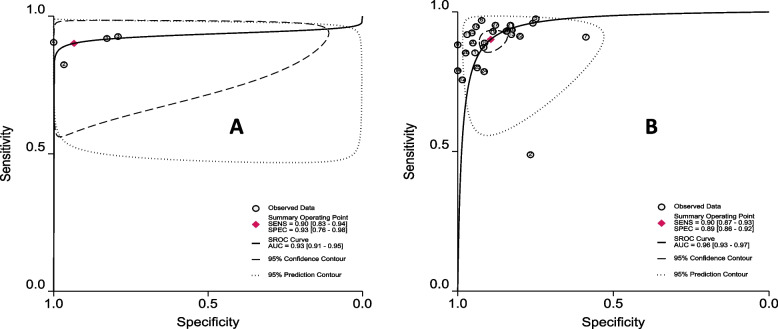
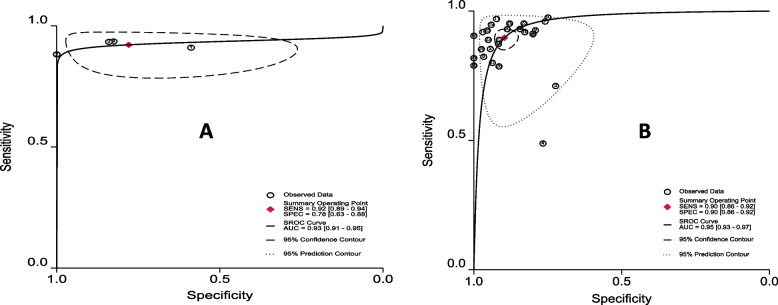
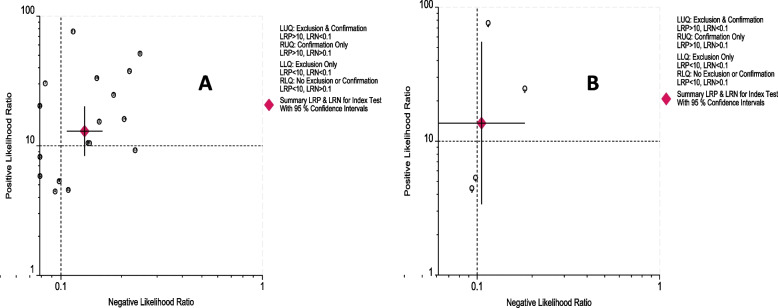
Results: In this study, 34 out of the 99 identified studies were included in the meta-analysis. Analysis of the ROMA index in postmenopausal Asian women revealed a sensitivity of 88%, specificity of 93%, diagnostic odds ratio (DOR) of 99, positive likelihood ratio (LR +) of 13, negative likelihood ratio (LR-) of 0.131, and inverse negative likelihood ratio (1/LR-) of 8. Furthermore, in cross-sectional studies conducted on postmenopausal women, the ROMA index demonstrated a sensitivity of 90%, specificity of 93%, DOR of 129, LR + of 14, LR - of 0.106, and 1/LR - of 9. Finally, with a cut-off range of 25.1-40, the ROMA index showed a sensitivity of 90%, specificity of 90%, DOR of 76, LR + of 9, LR- of 0.115, and 1/LR- of 9. No significant publication bias was detected in this study (P > 0.05).
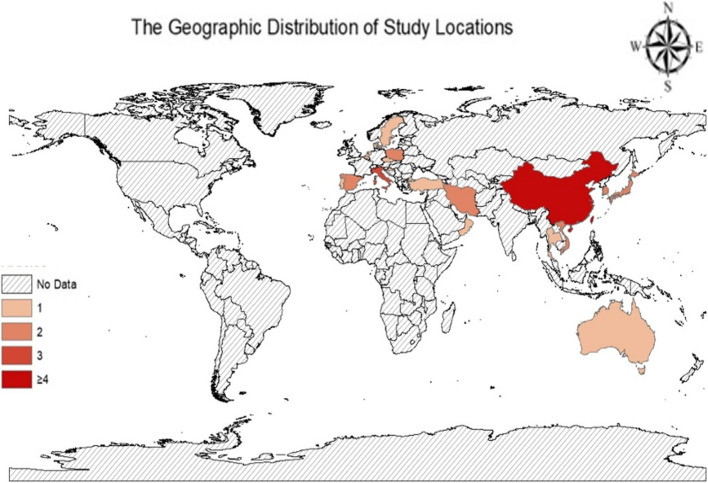
Conclusion: The ROMA index showed greater efficacy in postmenopausal Asian women than in their European counterparts. Cross-sectional studies produced larger estimates than cohort studies. Furthermore, the highest estimate of the ROMA index was obtained with a cutoff of (25.1-40) as opposed to (10-25).
Keywords: Diagnostic value; Meta-analysis; Ovarian cancer; ROMA; Systematic review.
© 2025. The Author(s).
Conflict of interest statement
Declarations. Ethics approval and consent to participate: Not applicable. Clinical trial number: Not applicable. Consent for publication: Not applicable. Competing interests: The authors declare no competing interests.
Figures

Similar articles
-
Menopausal status, ultrasound and biomarker tests in combination for the diagnosis of ovarian cancer in symptomatic women.Cochrane Database Syst Rev. 2022 Jul 26;7(7):CD011964. doi: 10.1002/14651858.CD011964.pub2. Cochrane Database Syst Rev. 2022. PMID: 35879201 Free PMC article.
-
Intraoperative frozen section analysis for the diagnosis of early stage ovarian cancer in suspicious pelvic masses.Cochrane Database Syst Rev. 2016 Mar 1;3(3):CD010360. doi: 10.1002/14651858.CD010360.pub2. Cochrane Database Syst Rev. 2016. PMID: 26930463 Free PMC article.
-
Diagnostic Performance of Risk of Ovarian Malignancy Algorithm Against CA125 and HE4 in Connection With Ovarian Cancer: A Meta-analysis.Int J Gynecol Cancer. 2016 Nov;26(9):1586-1593. doi: 10.1097/IGC.0000000000000804. Int J Gynecol Cancer. 2016. PMID: 27540691
-
Blood biomarkers for the non-invasive diagnosis of endometriosis.Cochrane Database Syst Rev. 2016 May 1;2016(5):CD012179. doi: 10.1002/14651858.CD012179. Cochrane Database Syst Rev. 2016. PMID: 27132058 Free PMC article.
-
Guaiac-based faecal occult blood tests versus faecal immunochemical tests for colorectal cancer screening in average-risk individuals.Cochrane Database Syst Rev. 2022 Jun 6;6(6):CD009276. doi: 10.1002/14651858.CD009276.pub2. Cochrane Database Syst Rev. 2022. PMID: 35665911 Free PMC article.
References
-
- Dikmen Z, Colak A, Dogan P, Tuncer S, Akbiyik F. Diagnostic performances of CA125, HE4, and ROMA index in ovarian cancer. Eur J Gynaecol Oncol. 2015;36(4):457–62. - PubMed
-
- Rahimpour E, Niroomand B, Kalatehjari M, Shahbakhti F, Bahardoust M, Goodarzy B, et al. Effect of the Number of Negative Lymph Nodes Removed on the Survival and Recurrence Rate After Primary Surgery in Patients with Ovarian Cancer: A Multi-Center Retrospective Cohort Study. Indian Journal of Surgical Oncology. 2024:1–7. - PMC - PubMed
Publication types
MeSH terms
LinkOut - more resources
Full Text Sources
Medical
