. 2025 Jun 5;13(1):27.
doi: 10.1186/s40170-025-00396-0.

A role of arginase-1-expressing myeloid cells in cachexia

Affiliations

A role of arginase-1-expressing myeloid cells in cachexia

Lamsal Apsana et al. Cancer Metab. .

Abstract

Background: Despite decades of efforts to find successful treatment approaches, cachexia remains a major unmet medical need. This condition, that affects patients with diverse underlying conditions, is characterized by severe muscle loss and is associated with reduced quality of life and limited survival. Search for underlying mechanisms that may guide cachexia treatment has mainly evolved around potential atrophy-inducing roles of inflammatory mediators, and in cancer patients, tumor-derived factors. Recently, a new paradigm emerged as it is becoming evident that specific immune cells inhabit atrophic muscle tissue. Arginase 1 (Arg1) expression is characteristic of these immune cells. Studies of potential contributions of these immune cells to loss of muscle mass and function is in its infancy, and the contribution of ARG1 to these processes remains elusive.

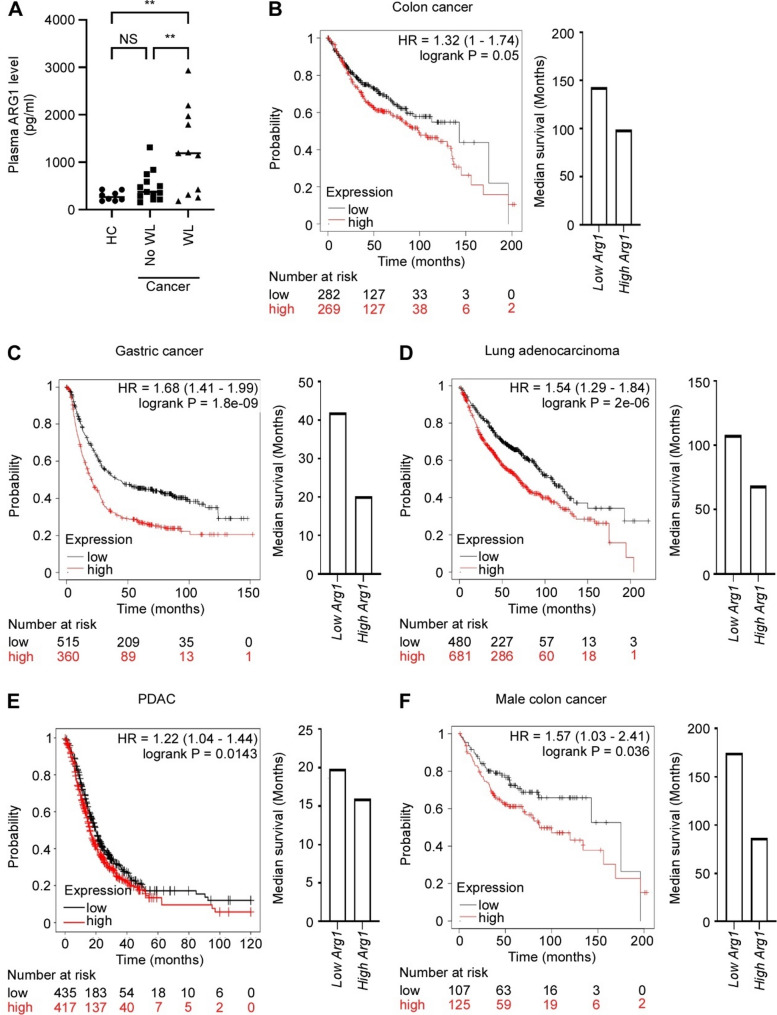
Methods: Analyses of RNA sequencing data from murine cachexia models and comprehensive, unbiased open approach proteomics analyses of skeletal myotubes was performed. In vitro techniques were employed to evaluate mitochondrial function and capacity in skeletal muscle cells and cardiomyocytes. Functional bioassays were used to measure autophagy activity. ARG1 level in patients' plasma was evaluated using ELISA, and the association between ARG1 level and patient survival, across multiple types of cancer, was examined using the online database Kaplan-Meier plotter.

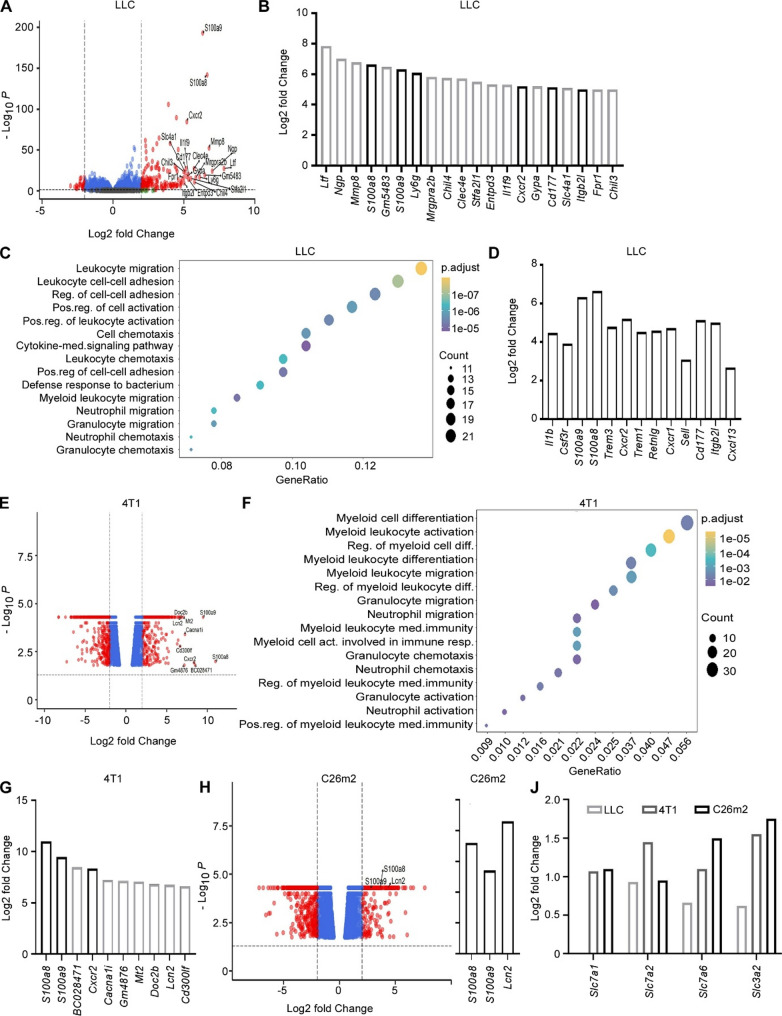
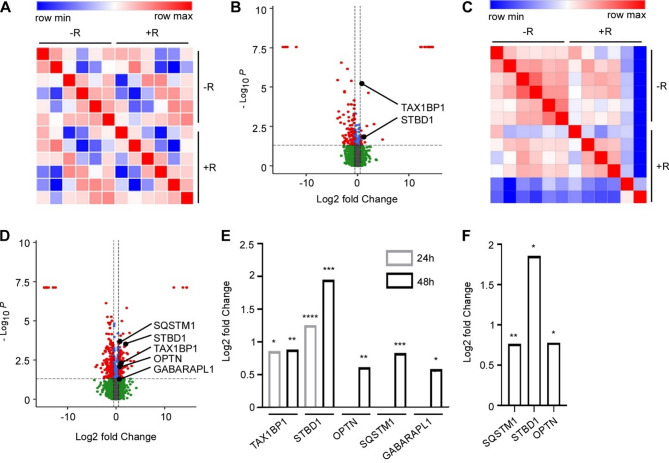
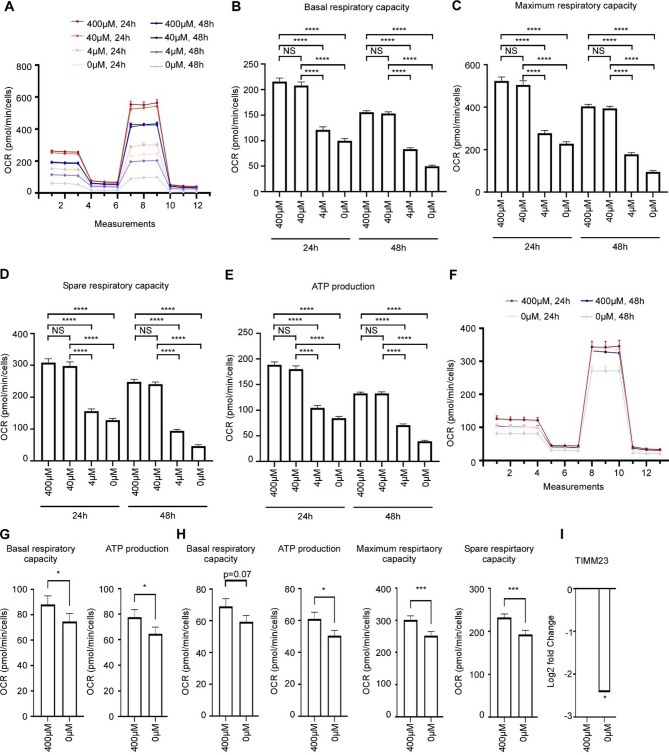
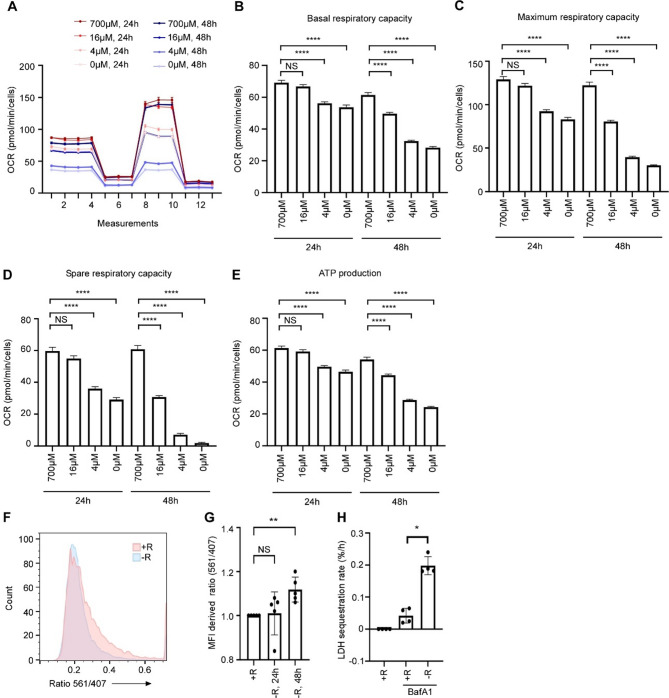
Results: In line with arginine-degrading activity of ARG1, we found signs of arginine restriction in atrophic muscles. In response to arginine restriction, mitochondrial functions and ATP generation was severely compromised in both skeletal muscle cells and in cardiomyocytes. In skeletal muscle cells, arginine restriction enhanced the expression of autophagic proteins, suggesting autophagic degradation of cellular content. Reduction in mitochondria marker TIMM23 supports selective autophagic degradation of mitochondria (mitophagy). In arginine starved cardiomyocytes, mitochondrial dysfunction is accompanied by both increased bulk autophagy and mitophagy. In cancer patients, we found an association between ARG1 expression and accelerated weight loss and reduced survival, further supporting a role of ARG1-producing cells in cachexia pathogenesis.

Conclusion: Together, our findings point to a mechanism for cachexia which depends on expansion of ARG1-expressing myeloid cells, local restriction of arginine, loss of mitochondrial capacity and induced catabolism in skeletal muscle cells and in the heart.

Keywords: ARG1; Arginine; Autophagy; Cachexia; Cancer; Mitochondria; Mitophagy; Muscle; Myeloid-derived suppressor cell; Neutrophil.


Conflict of interest statement

Declarations. Ethical approval and consent to participate: Experiments involving patient material were performed in accordance with the approval from the local ethical committee (Lothian Regional Ethics Committee (REC), Scotland, 06/S1103/75). Written informed consent was received from participants prior to inclusion in the study and the study was performed in conformity with the declaration of Helsinki. Consent for publication: Not applicable. Competing interests: The authors declare no competing interests.

Figures

Fig. 1
Fig. 1
Markers of neutrophils and MDSCs are enriched in atrophic muscle from mice. (A) Volcano plots showing differentially expressed genes in muscles from LLC-bearing mice vs. healthy mice. Red points represent genes with log2FC within the cut-off > ± 2 and adjusted p-value < 0.05. (B) Top 20 most upregulated transcripts in muscles from LLC-bearing mice vs. healthy mice. (C) Gene Ontology (GO) analysis of the most enriched biological processes (BP) associated with upregulated genes in muscles from LLC-bearing mice vs. healthy mice (log2FC > 2). (D) Upregulated transcripts in LLC-bearing mice vs. healthy mice (log2FC > 2, adjusted p-value < 0.05) that are associated with the biological processes “myeloid leukocyte migration”, “neutrophil migration”, “granulocyte migration”, “neutrophil chemotaxis”, and “granulocyte chemotaxis”. (E) As in A, but from 4T1-bearing mice. (F) GO enrichment-defined biological processes identified by the terms “myeloid”, “neutrophil” or “granulocyte” associated with the upregulated transcripts in muscles from 4T1-bearing mice vs. healthy mice (log2FC > 2). (G) Top 10 most upregulated transcripts in muscles from 4T1-bearing mice vs. healthy mice. (H) As in A, but from C26m2-bearing mice. (I) Upregulated S100a8, S100a9 and Lcn2 transcripts in C26m2-bearing mice vs. healthy mice. (J) Expression of transcripts encoding plasma membrane transporters that accept arginine as a substrate, in atrophic muscles from Lewis lung carcinoma (LLC)-, 4T1, and C26 tumor-bearing mice vs. healthy murine muscles (Log2FC)
Fig. 2
Fig. 2
The level of autophagic proteins is increased in arginine-starved muscle cells. (A) Pearson correlation matrix of the 4720 proteins detected in mass spectrometry (MS) analysis of C2C12 myotubes grown in medium without arginine or with arginine (400µM) for 24 h (-R and + R, respectively). (B) Volcano plots showing differentially expressed proteins in C2C12 myotubes grown without arginine vs. with arginine (400µM) for 24 h. Red points represent proteins with log2FC > ± 0.5 and adjusted p-value < 0.05. Autophagic proteins are pointed out. C-D) As A and B, respectively, but cells are grown for 48 h. E-F) Level of detected autophagic proteins in C2C12 myotubes grown without arginine vs. with arginine (400µM) for 24 h and 48 h, only positive fold change and detected proteins at specified time points shown (E) and in C2C12 myotubes grown in minimal arginine (4µM) vs. surplus arginine (400µM) for 48 h (F). Statistical significance was evaluated using Student’s t-test corrected using Benjamini-Hochberg. *p < 0.05, ** p < 0.01, *** p < 0.001 and **** p < 0.0001
Fig. 3
Fig. 3
Mitochondrial functions are impaired in arginine-starved muscle cells. A) Measurement of mitochondrial function in arginine restricted C2C12 myoblasts, as indicated, using a Seahorse XF96 Analyzer (n = 3). Data are shown as mean +/-SEM. B-E) Basal respiratory capacity (B), Maximum respiratory capacity (C), Spare respiratory capacity (D), and ATP production (E) in arginine restricted C2C12 myoblasts (n = 3). Data are shown as mean +/-SEM. Statistical significance was evaluated using one-way ANOVA followed by Dunnet’s multiple comparisons test. F) Measurement of mitochondrial function in arginine restricted C2C12 myotubes, as indicated, using a Seahorse XF96 Analyzer (n = 5). G) Basal respiratory capacity and ATP production in C2C12 myotubes grown in media containing 400µM or 0µM arginine for 24 h. H) Basal respiratory capacity, ATP production, Maximum respiratory capacity, and Spare respiratory capacity in C2C12 myotubes grown in media containing 400µM or 0µM arginine for 48 h (n = 5). Statistical significance was evaluated using Mann-Whitney test. I) Level of TIMM23 protein in C2C12 myotubes grown in media containing 400µM or 0µM arginine for 48 h. Statistical significance was evaluated using Student’s t-test. NS = not significant, *p < 0.05, ** p < 0.01, *** p < 0.001 and **** p < 0.0001
Fig. 4
Fig. 4
Mitochondrial functions are impaired and mitophagy accelerated in arginine-starved cardiomyocytes. A) Measurement of mitochondrial function in arginine restricted AC16 cardiomyocytes, as indicated, using a Seahorse XF96 Analyzer (n = 4). Data are shown as mean +/-SEM. B-E) Basal respiratory capacity (B), Maximum respiratory capacity (C), Spare respiratory capacity (D), and ATP production (E) in arginine restricted AC16 cardiomyocytes (n = 4). Data are shown as mean +/-SEM. Statistical significance was evaluated after log-transformation, using one-way ANOVA followed by Dunnet’s multiple comparisons test. F) AC16 cardiomyocytes expressing mito-mKeima grown with 400µM arginine (+ R) or no arginine (-R) (48 h). Representative histograms of the signal ratio by excitation at 561 and 407 nm are shown. G) Average median ratio for signals by excitation at 561 and 407 nm in AC16 cardiomyocytes expressing mito-mKeima grown in 400 µM arginine (+ R) or without arginine (-R) for 24 and 48 h (n = 5). Data are shown as mean +/-SEM. Statistical significance was evaluated using Kruskal-Wallis followed by Dunn’s multiple comparisons test. H) Lactate dehydrogenase (LDH) sequestration determined in AC16 cardiomyocytes grown in medium with arginine (700µM) or without arginine (+ R and -R, respectively), +/-Bafilomycin A1 (BafA1, 100nM) for 24 h, using an LDH sequestration assay [26] (n = 4). Statistical significance was evaluated using Mann-Whitneys test. NS = not significant, *p < 0.05, ** p < 0.01, *** p < 0.001 and **** p < 0.0001
Fig. 5
Fig. 5
High arginase 1 levels are associated with weight loss and short survival. A) ARG1 level in plasma from healthy control subjects (HC, n = 8) and cancer patients with > 10% weight loss (WL, n = 11) or < 2% WL (n = 13), measured by elisa. Statistical significance was evaluated using one-way ANOVA followed by Tukey’s multiple comparisons test. ** p < 0.01, NS = not significant. B-E) Relationship between ARG1 gene expression in tumor tissue and overall survival of colon cancer (B), gastric cancer (C), Lung adenocarcinoma (D), Pancreatic ductal adenocarcinoma/PDAC (E), and male colon cancer patients (F). HR = hazard ratio. The data are obtained using the kmplot.com database tool [29]. High and low expression were defined as described in the method section

References

    1. von Haehling S, Anker SD. Prevalence, incidence and clinical impact of cachexia: facts and numbers-update 2014. J cachexia Sarcopenia Muscle. 2014;5(4):261–3. - PMC - PubMed
    1. Vagnildhaug OM, Balstad TR, Almberg SS, Brunelli C, Knudsen AK, Kaasa S, et al. A cross-sectional study examining the prevalence of cachexia and areas of unmet need in patients with cancer. Supportive Care Cancer: Official J Multinational Association Supportive Care Cancer. 2018;26(6):1871–80. - PubMed
    1. Tesi RJ. MDSC; the most important cell you have never heard of. Trends Pharmacol Sci. 2019;40(1):4–7. - PubMed
    1. VanderVeen BN, Murphy EA, Carson JA. The impact of immune cells on the skeletal muscle microenvironment during Cancer cachexia. Front Physiol. 2020;11:1037. - PMC - PubMed
    1. Cui P, Shao W, Huang C, Wu CJ, Jiang B, Lin D. Metabolic derangements of skeletal muscle from a murine model of glioma cachexia. Skelet Muscle. 2019;9(1):3. - PMC - PubMed

LinkOut - more resources