

Epidemiological trends in abortion and miscarriage between 1990 and 2019
- PMID: 40474281
- PMCID: PMC12143105
- DOI: 10.1186/s12978-025-02049-3
Epidemiological trends in abortion and miscarriage between 1990 and 2019
Keywords: Abortion; Disability-adjusted life-years; Global burden of disease; Social development index.
Plain language summary
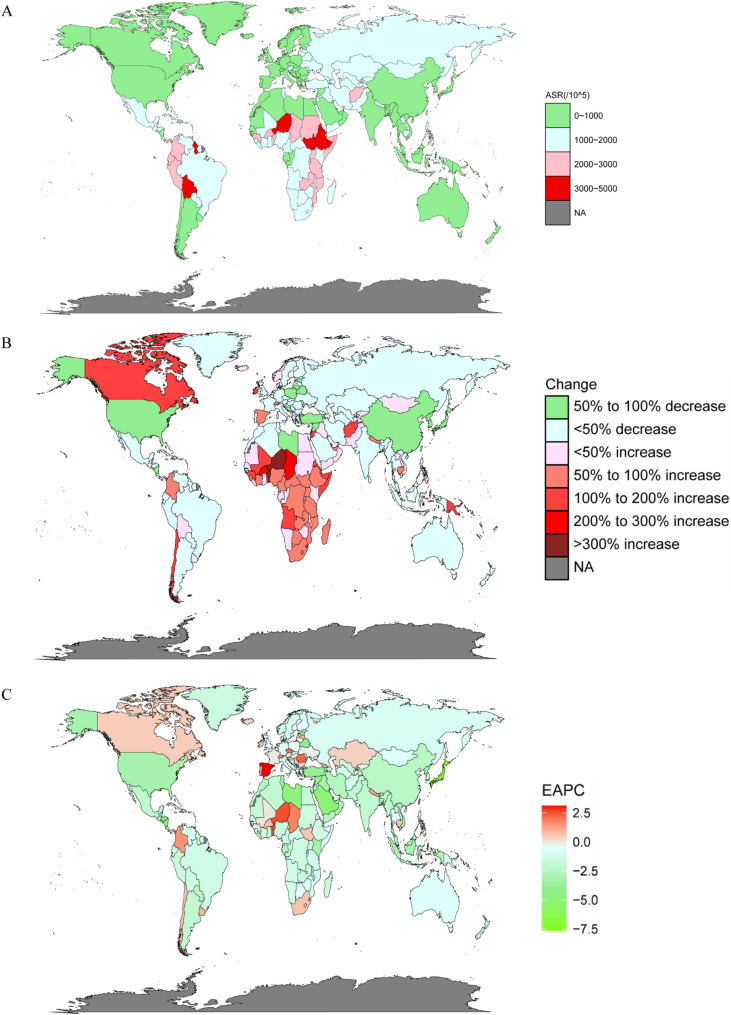
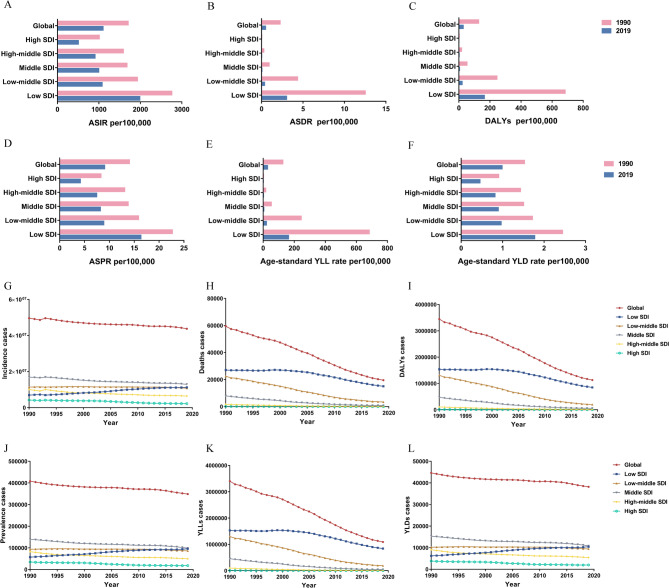
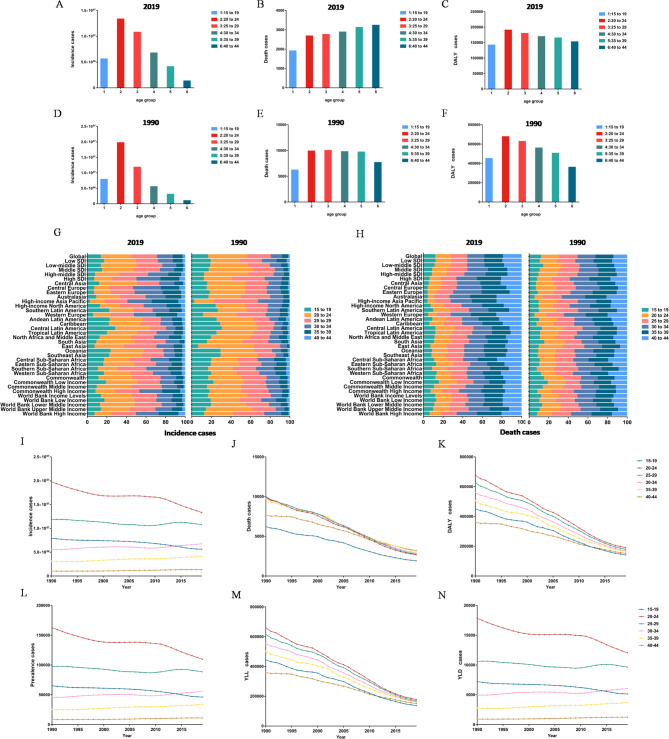
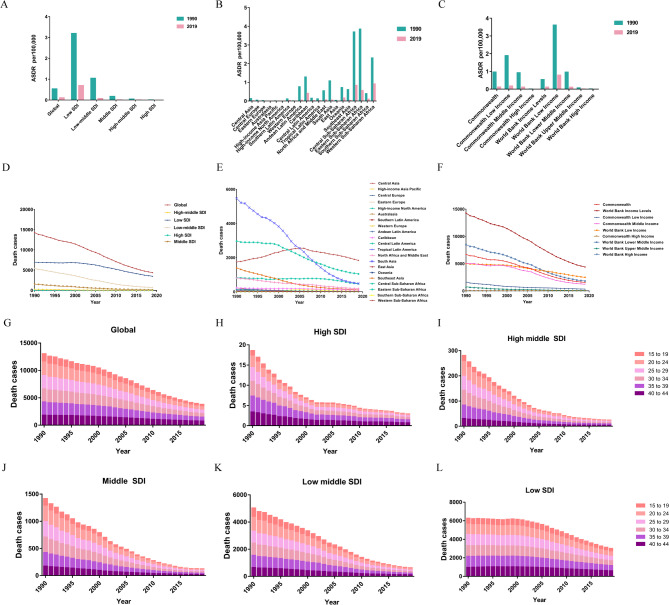
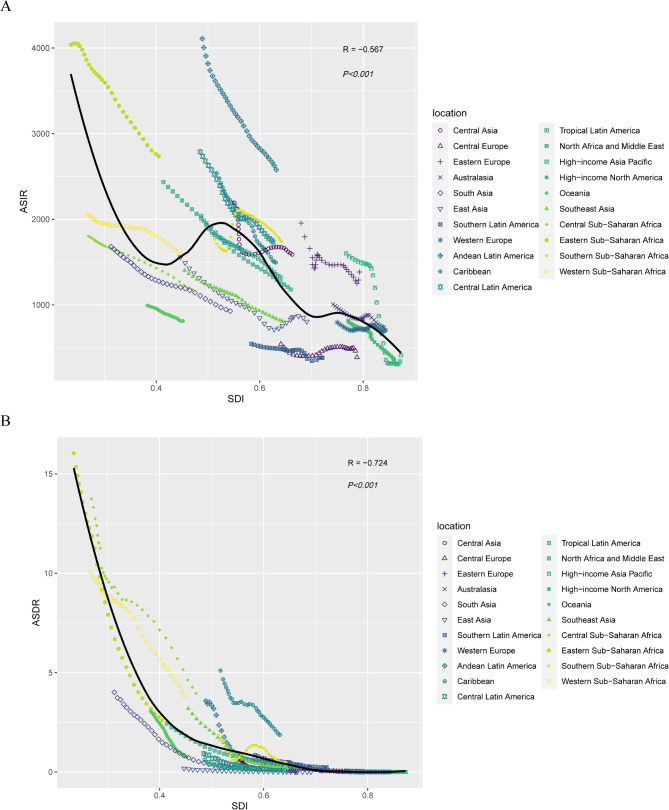
Abortion and miscarriage both lead to pregnancy loss. Unsafe abortion, in particular, greatly impairs maternal reproductive health. Understanding the burden and epidemiological trends of abortion and miscarriage is essential for informing public health strategies. In this study, we used the Global Burden of Disease Study (GBD) 2019 to comprehensively analyse the burden of abortion and miscarriage from 1990 to 2019. Although our study observed a global decline in incidence from 1990 to 2019, abortion and miscarriage remains significant reproductive health concerns in low-SDI countries. The low-SDI had much greater age-standardized rates of incidence, deaths and DALYs than the other SDI quintiles. Globally, a high incidence was observed for women aged 20 to 29 years, and a greater number of deaths was recorded for women aged 35 to 44 years.Our study may provide useful theoretical data for reproductive health interventions. Studying the epidemiology of abortion and miscarriage, identifying key risk factors and regional disparities, can enable healthcare systems to implement targeted interventions to protect reproductive health effectively.
Conflict of interest statement
Declarations. Ethics approval and consent to participate: Not applicable. Consent for publication: Not applicable. This study does not contain data from any individual person. Competing interests: The authors declare no competing interests.
Figures
Similar articles
-
Long-term trends in the global burden of maternal abortion and miscarriage from 1990 to 2021: joinpoint regression and age-period-cohort analysis.BMC Public Health. 2025 Apr 26;25(1):1554. doi: 10.1186/s12889-025-22716-1. BMC Public Health. 2025. PMID: 40287625 Free PMC article.
-
Global, regional, and national comparative risk assessment of 84 behavioural, environmental and occupational, and metabolic risks or clusters of risks for 195 countries and territories, 1990-2017: a systematic analysis for the Global Burden of Disease Study 2017.Lancet. 2018 Nov 10;392(10159):1923-1994. doi: 10.1016/S0140-6736(18)32225-6. Epub 2018 Nov 8. Lancet. 2018. PMID: 30496105 Free PMC article.
-
The epidemiology of pregnancy loss: global burden, variable risk factors, and predictions.Hum Reprod. 2024 Apr 3;39(4):834-848. doi: 10.1093/humrep/deae008. Hum Reprod. 2024. PMID: 38308812 Review.
-
Global, regional, and national trends in osteoarthritis disability-adjusted life years (DALYs) from 1990 to 2019: a comprehensive analysis of the global burden of disease study.Public Health. 2024 Jan;226:261-272. doi: 10.1016/j.puhe.2023.10.030. Epub 2023 Dec 21. Public Health. 2024. PMID: 38134839
-
Cancer Incidence, Mortality, Years of Life Lost, Years Lived With Disability, and Disability-Adjusted Life Years for 29 Cancer Groups From 2010 to 2019: A Systematic Analysis for the Global Burden of Disease Study 2019.JAMA Oncol. 2022 Mar 1;8(3):420-444. doi: 10.1001/jamaoncol.2021.6987. JAMA Oncol. 2022. PMID: 34967848 Free PMC article.
References
-
- Sedgh G, Henshaw SK, Singh S, Bankole A, Drescher J. Legal abortion worldwide: incidence and recent trends. Perspect Sex Reprod Health. 2007;39(4):216–25. - PubMed
-
- Bearak J, Popinchalk A, Ganatra B, Moller AB, Tunçalp Ö, Beavin C, et al. Unintended pregnancy and abortion by income, region, and the legal status of abortion: estimates from a comprehensive model for 1990–2019. Lancet Glob Health. 2020;8(9):e1152–61. - PubMed
-
- Quenby S, Gallos ID, Dhillon-Smith RK, Podesek M, Stephenson MD, Fisher J, et al. Miscarriage matters: the epidemiological, physical, psychological, and economic costs of early pregnancy loss. Lancet. 2021;397(10285):1658–67. - PubMed
Grants and funding
LinkOut - more resources
Full Text Sources
