

Dissecting the tumor microenvironment in primary breast angiosarcoma: insights from single-cell RNA sequencing
- PMID: 40474296
- PMCID: PMC12142952
- DOI: 10.1186/s13058-025-02022-9
Dissecting the tumor microenvironment in primary breast angiosarcoma: insights from single-cell RNA sequencing
Abstract
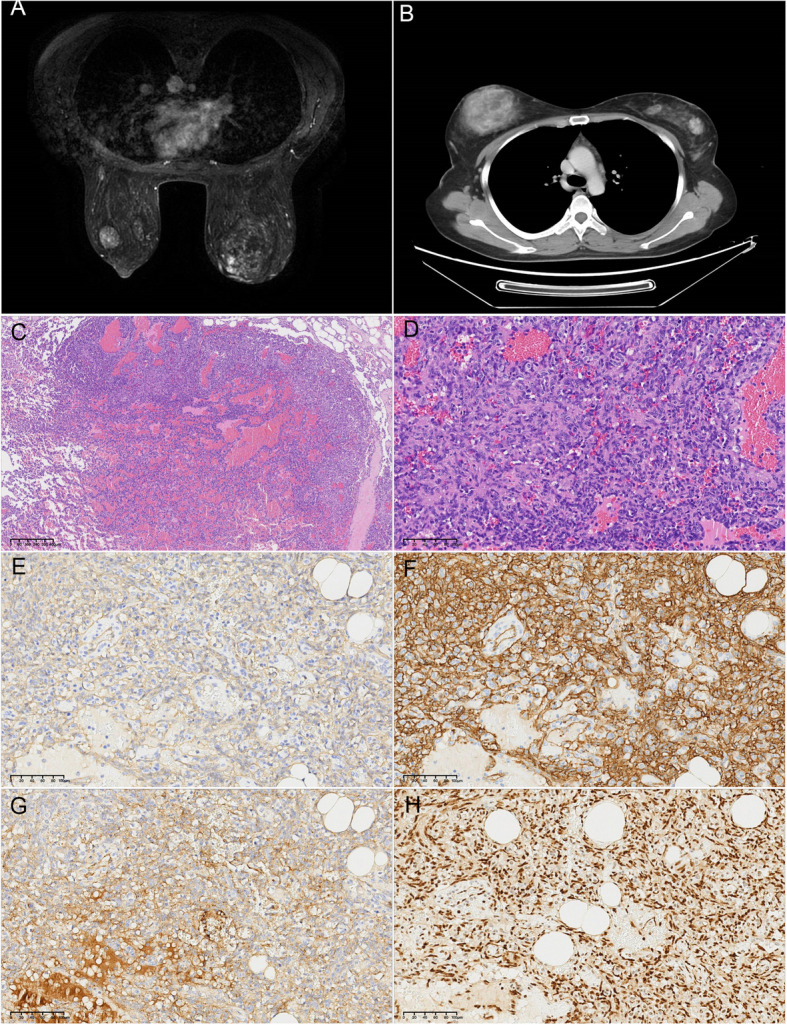
Background: Angiosarcoma, a rare and highly aggressive malignancy originating from vascular endothelial cells, is characterized by its rapid progression, high invasiveness, and poor prognosis. Due to the limited understanding of its tumor microenvironment (TME) and the absence of effective treatments, further research is essential to elucidate its pathogenic mechanisms and improve therapeutic strategies.
Objective: This study aims to characterize the cellular heterogeneity and unique TME of primary breast angiosarcoma using single-cell RNA sequencing (scRNA-seq), to identify potential therapeutic targets and improve clinical outcomes.
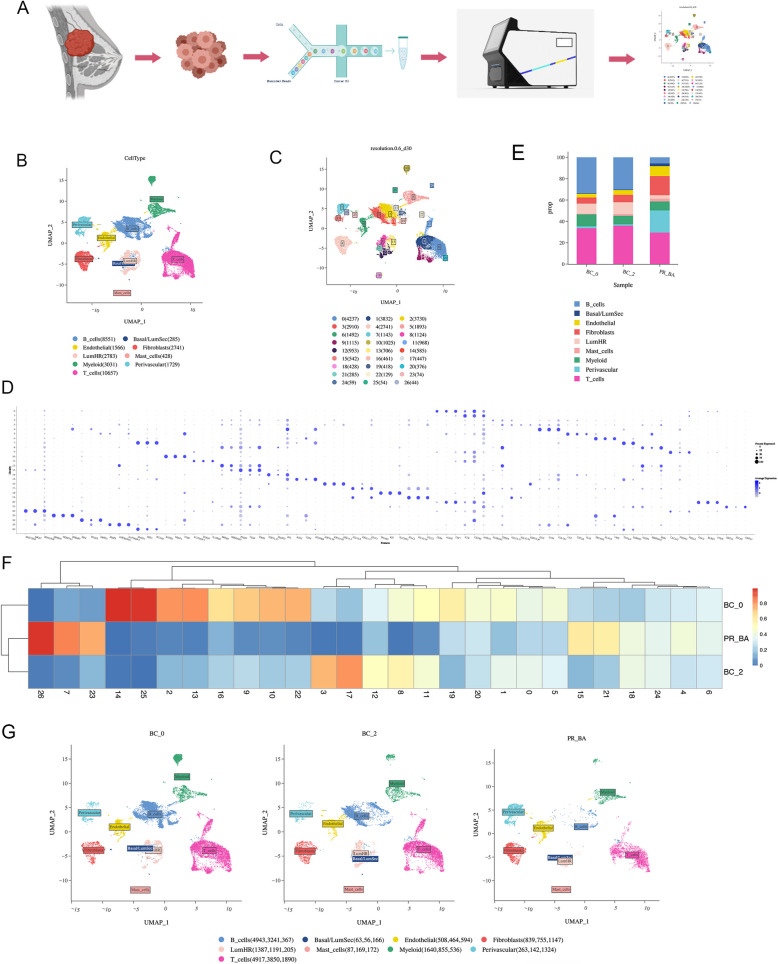
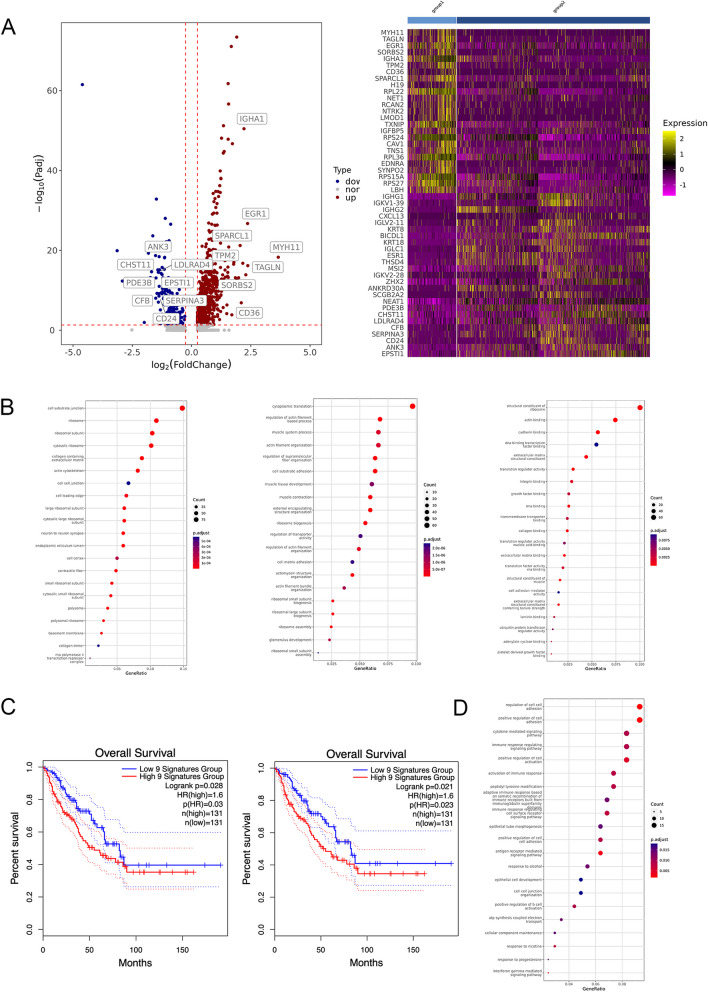
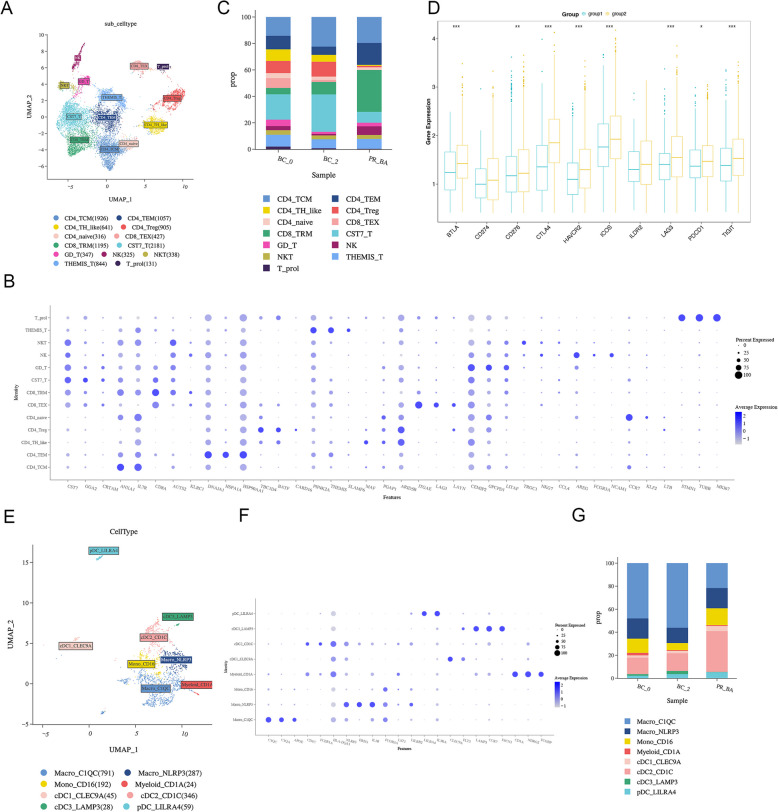
Methods: Tumor samples were obtained from a patient with bilateral primary breast angiosarcoma and two patients with invasive breast cancer. Single-cell RNA sequencing (scRNA-seq) was conducted to capture the transcriptomic profiles of individual cells within the tumor samples. Following stringent quality control, a total of 31,771 cells were analyzed using comprehensive bioinformatics approaches. Cell populations were identified and classified into distinct cell types, and differential gene expression analysis was performed to explore key signaling pathways. Functional enrichment analysis was used to identify pathways related to tumor progression and immune evasion. Additionally, cell-cell communication networks were mapped to understand interactions within the TME, with a focus on pathways that may serve as therapeutic targets.
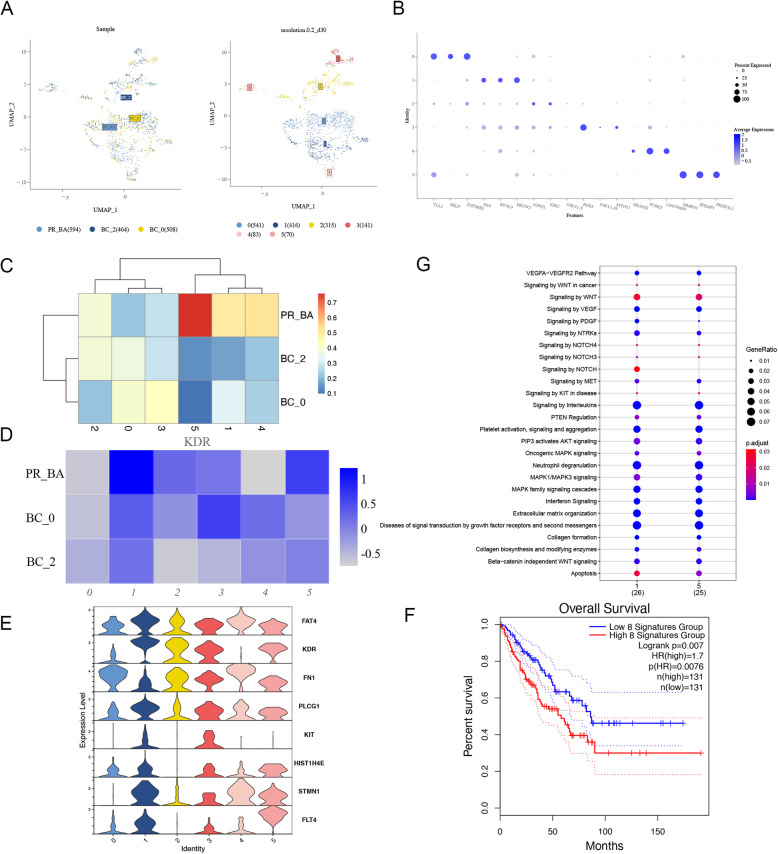
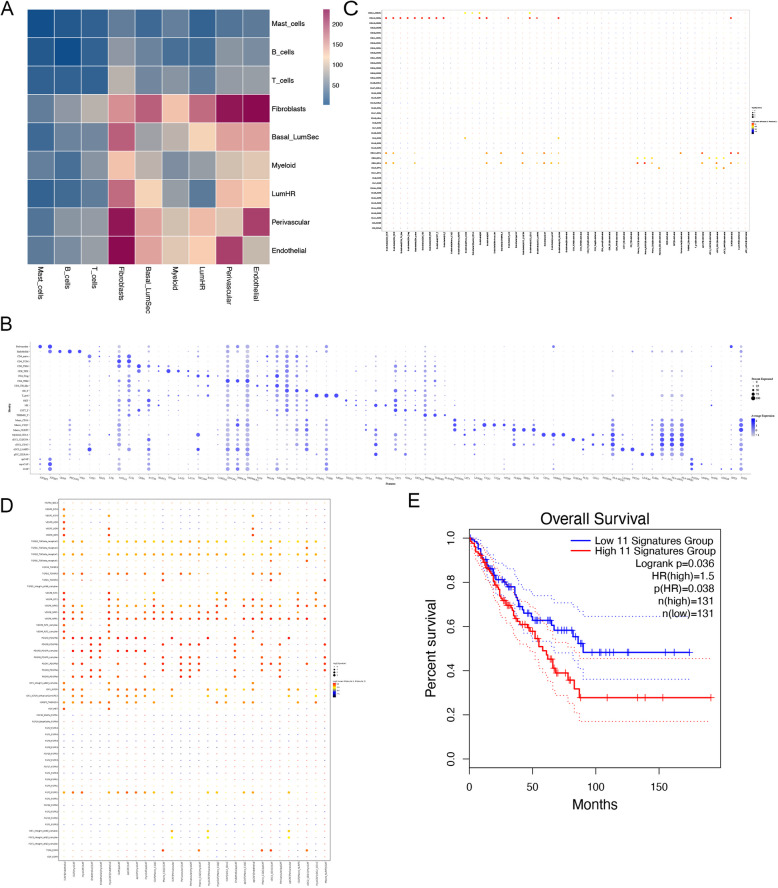
Results: The scRNA-seq analysis revealed significant differences in the distribution of perivascular cells, fibroblasts, T cells, endothelial cells, and myeloid cells in breast angiosarcoma compared to invasive breast cancer. Key pathways enriched in angiosarcoma samples included growth factor binding, platelet-derived growth factor binding, and ribosome biogenesis, with abnormal expression of several ribosomal proteins. Notably, genes such as FAT4, KDR, FN1, and KIT were highly expressed in angiosarcoma endothelial cells, correlating with poor prognosis. Cell communication analysis highlighted the CXCL12-CXCR4 axis as a crucial mediator of the TME in angiosarcoma.
Conclusion: This study provides critical insights into the TME of primary breast angiosarcoma, highlighting potential molecular targets and pathways for therapeutic intervention. These findings may inform the development of more effective treatment strategies for this rare and challenging tumor type.
Keywords: Breast angiosarcoma; Breast cancer; ScRNA-seq; Tumor microenvironment.
© 2025. The Author(s).
Conflict of interest statement
Declarations. Ethics approval and consent to participate: The study involving human participants was reviewed and approved by the Ethics Committee of National Cancer Center/Cancer Hospital, Chinese Academy of Medical Sciences (NCC2024G-263). All samples were collected with the universal consent form from the enrolled patients. Consent for publication: Written informed consent was obtained from all patients for the publication of any potentially identifiable images or data presented in this article. Competing interests: The authors declare no competing interests.
Figures
Similar articles
-
Investigating intra-tumoural heterogeneity and microenvironment diversity in primary cardiac angiosarcoma through single-cell RNA sequencing.Clin Transl Med. 2024 Dec;14(12):e70113. doi: 10.1002/ctm2.70113. Clin Transl Med. 2024. PMID: 39658531 Free PMC article.
-
Characterizing tumor biology and immune microenvironment in high-grade serous ovarian cancer via single-cell RNA sequencing: insights for targeted and personalized immunotherapy strategies.Front Immunol. 2025 Jan 17;15:1500153. doi: 10.3389/fimmu.2024.1500153. eCollection 2024. Front Immunol. 2025. PMID: 39896800 Free PMC article.
-
Unveiling the NEFH+ malignant cell subtype: Insights from single-cell RNA sequencing in prostate cancer progression and tumor microenvironment interactions.Front Immunol. 2024 Dec 20;15:1517679. doi: 10.3389/fimmu.2024.1517679. eCollection 2024. Front Immunol. 2024. PMID: 39759507 Free PMC article.
-
Single-cell RNA sequencing in breast cancer: Understanding tumor heterogeneity and paving roads to individualized therapy.Cancer Commun (Lond). 2020 Aug;40(8):329-344. doi: 10.1002/cac2.12078. Epub 2020 Jul 12. Cancer Commun (Lond). 2020. PMID: 32654419 Free PMC article. Review.
-
Single-Cell RNA-Sequencing: Opening New Horizons for Breast Cancer Research.Int J Mol Sci. 2024 Aug 31;25(17):9482. doi: 10.3390/ijms25179482. Int J Mol Sci. 2024. PMID: 39273429 Free PMC article. Review.
Cited by
-
Mapping thirty years of tumour-microenvironment-driven drug resistance in breast cancer: a global bibliometric analysis.Discov Oncol. 2025 Aug 7;16(1):1489. doi: 10.1007/s12672-025-03324-2. Discov Oncol. 2025. PMID: 40772981 Free PMC article.
References
-
- Pandey M, Sutton GR, Giri S, Martin MG. grade and prognosis in localized primary angiosarcoma. Clin Breast Cancer. 2015;15:266–9. - PubMed
-
- Lin WM, Juan YH, Lin YC, Ueng SH, Lo YF, Cheung YC. Awareness of primary spontaneous hemorrhagic angiosarcoma of the breast associated with Kasabach-Merritt syndrome in a pregnant woman by enhanced magnetic resonance imaging: a CARE-compliant case report. Medicine (Baltimore). 2016;95:e5276. - PMC - PubMed
MeSH terms
Substances
Supplementary concepts
Grants and funding
LinkOut - more resources
Full Text Sources
Medical
Miscellaneous
