. 2025 Jun 5;44(1):172.
doi: 10.1186/s13046-025-03422-7.

Tumor suppressor SLC9A2 inhibits colorectal cancer metastasis and reverses immunotherapy resistance by suppressing angiogenesis

Affiliations

Tumor suppressor SLC9A2 inhibits colorectal cancer metastasis and reverses immunotherapy resistance by suppressing angiogenesis

Zizhen Zhang et al. J Exp Clin Cancer Res. .

Abstract

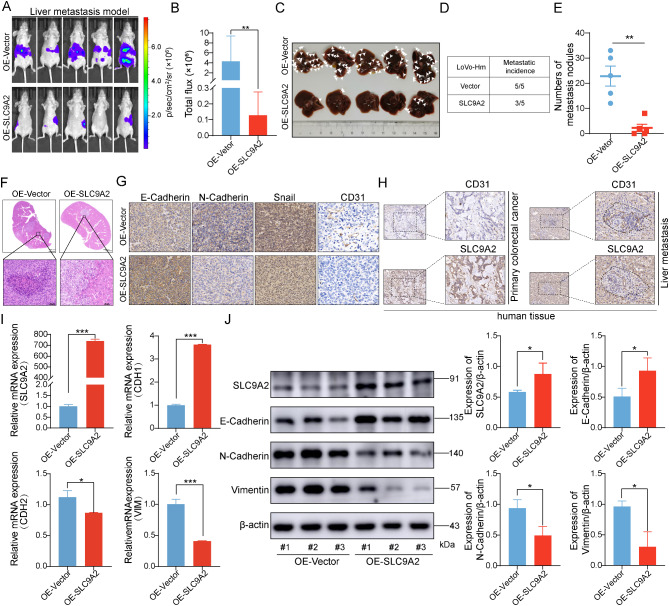
Background: Colorectal cancer (CRC) is a common and aggressive malignancy that frequently metastasizes to the liver, presenting significant therapeutic challenges. Despite its clinical importance, the mechanisms underlying CRC liver metastasis and resistance to immune therapy remain poorly understood. In this study, we aimed to investigate the molecular mechanisms driving CRC metastasis using a novel approach, which includes the establishment of highly metastatic CRC cell lines.

Methods: To explore the role of specific genes in CRC liver metastasis, we developed two highly metastatic CRC cell lines (LoVo-Hm and HCT116-Hm) by applying sustained selective pressure to primary CRC cells. RNA sequencing was performed to identify differentially expressed genes in these metastatic cells. Additionally, we conducted assays for cell migration, invasion, angiogenesis, and ELISA to evaluate VEGFA production, all to confirm the functional role of SLC9A2. Our findings were further validated in human CRC tissue samples and publicly available datasets to assess the clinical relevance of the identified targets.

Results: Our analysis revealed a significant downregulation of SLC9A2 in the highly metastatic CRC cell lines. Mechanistically, we found that SLC9A2 inhibits epithelial-mesenchymal transition (EMT) and metastasis by suppressing the STAT3 signaling pathway. Moreover, SLC9A2 reduces VEGFA secretion, normalizing tumor vasculature and reshaping the tumor microenvironment (TME), which ultimately enhances anti-tumor immunity. Comparative analysis of CRC tissue samples showed reduced SLC9A2 expression in tumor tissues compared to adjacent normal tissues, with a negative correlation to TNM staging. Importantly, higher SLC9A2 expression was associated with better treatment responses in immunotherapy cohorts.

Conclusion: These findings highlight the critical role of SLC9A2 in regulating metastasis, angiogenesis, and TME remodeling in CRC. By modulating the STAT3 pathway and tumor vasculature, SLC9A2 emerges as a potential prognostic biomarker and therapeutic target. Targeting SLC9A2 may enhance immune responses and improve treatment outcomes in CRC, offering a promising avenue for future therapeutic strategies.

Keywords: Angiogenesis; Colorectal Cancer; Liver metastasis, immunotherapy; SLC9A2.


Conflict of interest statement

Declarations. Ethics approval and consent to participate: Animal experiment is in accordance with the regulations of the Animal Care and Use Committee of the Peking University Cancer Hospital (EAEC-2023-13). Consent for publication: All authors agree to be published. Competing interests: The authors declare no competing interests.

Figures

Fig. 1
Fig. 1
Downregulation of SLC9A2 in hepatic metastases of CRC. (A) Schematic diagram showing the construction of a highly liver-metastatic colorectal cancer cell line. LoVo cells were subjected to three rounds of transwell selection, followed by intrasplenic injection in NOD/SCID mice to isolate liver metastases for 2D culture. The highly liver-metastatic cells obtained after three rounds of in vivo selection were designated as LoVo-Hm. (B) Representative images of LoVo and LoVo-Hm under bright field microscopy. (C) LoVo-Hm demonstrated enhanced motility over LoVo following selection, as assessed by migration and invasion assays. Cells were identified in representative images using DAPI for migration and crystal violet for invasion. (D) Mouse models of hepatic metastasis were established using LoVo and LoVo-Hm. After four weeks, in vivo bioluminescence imaging was performed, followed by euthanasia to dissect the liver and quantify metastatic lesions and liver weight (n = 5/group). (E) Mouse models of peritoneal metastasis were established using LoVo and LoVo-Hm. After four weeks, in vivo bioluminescence imaging was performed, followed by quantification of peritoneal metastatic lesions number and weight (n = 5/group). (F) Heatmap analysis of differentially expressed genes between LoVo and LoVo-Hm. (G-H) The GSE14297 dataset from the GEO database was selected, and a volcano plot was generated to illustrate differentially expressed genes (G) between primary CRC and liver metastases. The top 20 differentially expressed genes (log2-fold change > 2 or < -2, P < 0.05) were identified, and comparison with the RNA-seq data in Figure F revealed the shared downregulated gene SLC9A2 (H). (I) Uniform Manifold Approximation and Projection (UMAP) plots of the GSE146771 single-cell sequencing dataset reveals the expression of SLC9A2 in different cell types. (J-M) UMAP and dot plots from GSE178341 database illustrate SLC9A2 expression across various cell types, the box plot shows SLC9A2 expression in normal intestinal mucosa (N) versus colorectal cancer (T). (N) SLC9A2 expression in paired samples of primary CRC and liver metastases from the GSE14297 database. (O) Workflow diagram for the culture of patient-derived organoids from primary CRC and liver metastases. (P) Western blot analysis of SLC9A2 expression in PDOs from paired primary CRC and liver metastases (left), with grayscale intensity quantification (right). (Q) Representative images of immunohistochemical staining for CDX2, CK7, CK20, β-catenin, and Ki67 in PDOs from the primary CRC tumor and liver metastases. (R) Assessment of SLC9A2 levels in LoVo and LoVo-Hm cells was conducted using Western blot and RT-qPCR. (S) The association between SLC9A2 expression and OS in TCGA-CRC cohort. Data in bar graphs indicate mean ± SEM. *P < 0.05, **P < 0.01, ***P < 0.001. Student’s t test (C, D, E), paired Student’ s t test (N, P), log-rank test (S)
Fig. 2
Fig. 2
Downregulation of SLC9A2 is associated with adverse clinical features and correlates with an immunosuppressive microenvironment. (A) Forest map showing the results of Cox regression analysis on the average survival rate of SLC9A2 in multiple datasets containing survival information. OS for Overall survival; DFS for disease-free survival; RFS for recurrence-free survival; DSS for disease-specific survival and PFS for progression-free survival. (B-G) Correlation between SLC9A2 and clinical parameters in public databases, including tissue (B), microsatellite status (C), pathological stage (D), T stage (E), M stage (F), N stage (G). T: primary tumor stage; N: regional lymph node stage; M: distant metastasis. (H) Correlation analysis between SLC9A2 expression and infiltrating immune cells by TIMER database. (I) Analysis of the correlation between SLC9A2 and immunosuppressive molecules using the GEO database. (J) UMAP plot of all single cells colored according to the tissue group. (K) UMAP plot of all single cells colored according to major cell lineages. (L) UMAP plot showed that only epithelial cells express SLC9A2. (M) Dot plot of the expression alterations of SLC9A2 in baseline samples from different groups
Fig. 3
Fig. 3
SLC9A2 inhibits the migration and invasion of CRC cells and reverses the EMT process. (A-B) Migration and invasion assays were conducted on LoVo (A) and HCT116 (B) cells transfected with either siRNA-NC or siRNA-SLC9A2. (C) Migration and invasion assays were performed on LoVo-Hm cells overexpressing either Vector or SLC9A2. (D) The wound healing capacity of LoVo cells transfected with either siRNA-NC or siRNA-SLC9A2 was evaluated. (E) The wound healing capacity of LoVo cells overexpressing either Vector or SLC9A2 was assessed. (F) GSEA analysis was performed to explore the relationship between SLC9A2 expression and pathway enrichment. Spearman’ s correlation analysis was utilized to assess the correlation between the expression levels of CDH1, CDH2, SNAIL, and SLC9A2, using data from TCGA (G) Western blot was used to measure the expression levels of SLC9A2, E-Cadherin, N-Cadherin, Claudin-1, Snail in LoVo (left) and HCT116 (right) cells transfected with either siRNA-NC or siRNA-SLC9A2. (H) Western blot was used to measure the expression levels of SLC9A2, E-Cadherin, N-Cadherin, Claudin-1, Snail in LoVo-Hm cells overexpressing either Vector or SLC9A2. Data in bar graphs indicate mean ± SEM. *P < 0.05, **P < 0.01, ***P < 0.001, n.s., not significant. Multi-group analysis of variance (A, B, D), Student’s t test (C, E)
Fig. 4
Fig. 4
SLC9A2 inhibits the hepatic metastasis of colorectal cancer in vivo. (A-B) BALB/c nude mice models of hepatic metastasis were established using LoVo-Hm cells overexpressing either Vector or SLC9A2. After four weeks, in vivo bioluminescence imaging was performed (n = 5/group). (C-E) BALB/c nude mice were euthanized to dissect the liver and quantify metastatic lesions. (F) Representative images of H&E staining of BALB/c nude mice livers are presented. (G) IHC analysis was conducted to assess the expression of E-Cadherin, N-Cadherin, Snail, and CD31 in the liver metastatic lesions of BALB/c nude mice. (H) IHC analysis was performed to evaluate the expression of CD31 and SLC9A2 in the primary lesions and liver metastases of CRC patients. (I-J) RT-qPCR (I) and Western blot (J) analyses were performed to measure the levels of SLC9A2, E-Cadherin, N-Cadherin, and Vimentin in the liver metastatic lesions of BALB/c nude mice. Data in bar graphs indicate mean ± SEM, and data were analyzed using Student’s t tests. *P < 0.05, **P < 0.01, ***P < 0.001
Fig. 5
Fig. 5
SLC9A2 inhibits the migration and invasion of CRC cells by suppressing the STAT3 signaling pathway. (A) Pathway enrichment analysis was conducted to compare the SLC9A2-overexpressing CRC cells with the control group. (B) Western blot analysis was performed to measure the levels of SLC9A2, STAT3 and p-STAT3Y705 in HCT116 cells transfected with either siRNA-NC or siRNA-SLC9A2. (C) Western blot analysis was performed to measure the levels of SLC9A2, STAT3 and p-STAT3Y705 in HCT116-Hm cells overexpressing either Vector or SLC9A2. (D) HCT116 cells were transfected with either siRNA-NC or siRNA-SLC9A2, followed by treatment with or without 5 µM Stattic for 24 h. After 48 h, Western blot analysis was performed to evaluate the levels of STAT3 and p-STAT3Y705. (E-F) HCT116 cells were transfected with either siRNA-NC or siRNA-SLC9A2, and the siRNA-SLC9A2 group was subsequently treated with 5 µM Stattic for 24 h. Following a 48-hour incubation, nuclear-cytoplasmic separation was performed, and Western blot analysis was conducted to evaluate the levels of STAT3 and p-STAT3Y705 (E). Immunofluorescence was used to assess the nuclear localization of p- STAT3Y705 (F). (G) HCT116-Hm cells were transfected with either vector or SLC9A2. After 24 h, immunofluorescence was used to examine the nuclear localization of p-STAT3Y705. (H) Migration and invasion assays were conducted on HCT116 cells transfected with either siRNA-NC or siRNA-SLC9A2, and the siRNA-SLC9A2 group was subsequently treated with 5 µM Stattic for 24 h. (I) Wound healing assay was conducted on HCT116 cells transfected with either siRNA-NC or siRNA-SLC9A2, and the siRNA-SLC9A2 group was subsequently treated with 5 µM Stattic for 24 h. (J) Schematic diagram illustrating SLC9A2 knockdown and overexpression in PDOs from primary CRC and liver metastases to evaluate STAT3 activation. (K) Western blot analysis of p-STAT3Y705 levels in PDOs with SLC9A2 knockdown from primary CRC (left) and overexpression from liver metastases (right). (L) Western blot analysis of p-STAT3Y705 levels in mouse liver metastases as shown in Fig. 4C. Data in bar graphs indicate mean ± SEM. *P < 0.05, **P < 0.01, ***P < 0.001. Multi-group analysis of variance (B, H, I), Student’s t test (C, L)
Fig. 6
Fig. 6
SLC9A2 inhibits VEGFA expression and curbs tumor angiogenesis. (A) Gene Ontology analysis was performed to compare SLC9A2-overexpressing CRC cells with the control group. (B-C) Analysis of the correlation between SLC9A2 expression and angiogenesis pathway in the CancerSEA web server. (D) Analysis of the correlation between SLC9A2 expression and angiogenesis pathway genes in TNMplot database. (E) CM from LOVO-Hm or HCT116-Hm cells transfected with either an overexpression vector or SLC9A2 were used to stimulate HUVEC cells for tubule formation assays. (F) CM from LOVO transfected with either si-NC or si-SLC9A2 were used to stimulate HUVEC cells for tubule formation assays. (G) CM from HCT116 or CRC PDOs transfected with either si-NC or si-SLC9A2 were used to stimulate HUVEC cells for tubule formation assays. (H) CM from HCT116 cells transfected with either si-NC or si-SLC9A2 (top), and from HCT116-Hm cells transfected with either an overexpression vector or SLC9A2 (bottom), were used to stimulate HUVEC cells in migration assays. (I) CM from HCT116 cells transfected with either si-NC or si-SLC9A2 (top), and from HCT116-Hm cells transfected with either an overexpression vector or SLC9A2 (bottom), were used to stimulate HUVEC cells in invasion assays. (J) Western blot analysis was conducted to assess the expression levels of VEGFA in LOVO and HCT116 cells transfected with either si-NC or si-SLC9A2, as well as in LOVO-Hm or HCT116-Hm cells transfected with either an overexpression vector or SLC9A2 (left). Grayscale values were quantified (right). (K) HCT116 cells were transfected with either siRNA-NC or siRNA-SLC9A2, and the siRNA-SLC9A2 group was treated with 5 µM Stattic for 24 h. CM from the three groups were subsequently collected to stimulate HUVEC cells for tubule formation (top) and migration assay (bottom). (L) CHCT116 cells were transfected with either siRNA-NC or siRNA-SLC9A2, and the siRNA-SLC9A2 group was treated with 5 µM Stattic for 24 h. CM from the three groups were subsequently collected to stimulate HUVEC cells for EdU assay. (M) Flowchart of the in vivo tubule formation assay. (N) CM were collected from HCT116 cells transfected with either si-NC or si-SLC9A2, as well as from HCT116-Hm cells transfected with an overexpression vector or SLC9A2. HUVEC cells were then mixed with the CM and subcutaneously injected into nude mice (n = 3/group). After 7 days, the implants were harvested for H&E staining and CD31 IHC (left panel), followed by quantification of the number of tubules formed (right panel). Data in bar graphs indicate mean ± SEM. *P < 0.05, **P < 0.01, ***P < 0.001. Multi-group analysis of variance (F, G, J, K, L), Student’s t test (E, H, I, J, N)
Fig. 7
Fig. 7
Slc9a2 effectively reverses immune resistance in colorectal cancer by inhibiting angiogenesis. (A) Flowchart for the establishment of the MC38-R cell line demonstrating resistance to immunotherapy. MC38 cells that developed acquired resistance to immunotherapy were selected under low-dose PD-1 antibody pressure and designated as MC38-R. (B) Subcutaneous tumor models in C57BL/6 mice were constructed using both MC38-S (sensitive) and MC38-R cell lines (n = 4/group). Subsequent intraperitoneal injection of PD-1 monoclonal antibody was conducted to evaluate the efficacy of immunotherapy based on tumor weight. (C) Three mice from each group depicted in Fig. 7B were selected for H&E staining, as well as IHC staining for CD8 and CD31, followed by statistical analysis. (D) MC38-R cells were employed to establish subcutaneous tumor models in C57BL/6 mice. Upon reaching a tumor volume of 100 mm³, an SLC9A2 overexpression plasmid was intratumorally injected, accompanied by intraperitoneal administration of anti-PD-1 and oral administration of Bevacizumab. (E-G) Following four weeks of MC38-R subcutaneous tumor implantation, the mice were sacrificed, and tumors were dissected for photography and weight measurement (G). The volume changes of tumor growth were analyzed for each group (E), alongside assessments of body weight variations in the mice (F). (H) VEGFA levels in tumor tissues from each group of mice were quantified using ELISA, with the control group mean normalized to 1 for statistical analysis and graphical representation. (I-M) Tumor tissues depicted in Fig. 7E were embedded in paraffin and subjected to H&E staining (I), as well as CD31 (J) and CD8 (K) immunohistochemistry. Additionally, TUNEL (L) and EdU (M) staining were performed to assess tumor proliferation and apoptosis. (N) Granzyme B (left) and IFNγ (right) levels in tumor tissues from each group of mice were quantified using ELISA, with the control group mean normalized to 1 for statistical analysis and graphical representation. (O) Map of the slc9a2 pcDNA plasmid and validation of the transfection efficiency in MC38. (P) Western blot analysis was conducted to determine the levels of VEGFA and p-STAT3Y705. Data in bar graphs indicate mean ± SEM. *P < 0.05, **P < 0.01, ***P < 0.001, n.s., not significant. Student’s t test (B, C), multi-group analysis of variance (G, H, J, K, L, M, N)
Fig. 8
Fig. 8
Ruxolitinib Augments the Effectiveness of Anti-PD-1 Immunotherapy against CRC. (A) MC38-R cells were used to establish subcutaneous tumor models in C57BL/6 mice. Starting on day 10, mice received intraperitoneal injections of anti-PD1, followed by oral administration of ruxolitinib starting on day 13. (B-D) Mice were sacrificed two weeks later, and tumors were harvested for photography and weight measurement (B). Tumor volume changes were analyzed for each group (D), along with assessments of body weight variations in the mice (C). (E) Western blot analysis was conducted to determine the levels of VEGFA and p-STAT3Y705 in the tumor tissues. (F-G) Levels of VEGFA (F), IFNγ, and Granzyme B (G) in tumor tissues from each group of mice were quantified using ELISA. The mean of the control group was normalized to 1 for statistical analysis and graphical representation. (H) Tumor tissues were embedded in paraffin and subjected to H&E staining, as well as immunohistochemical analysis for CD8, CD31, Ki-67 and TUNEL staining. (I) Diagram illustrating the proposed mechanism by which SLC9A2 inhibits immune evasion in CRC. Data in bar graphs indicate mean ± SEM, and data were analyzed using multi-group analysis of variance. *P < 0.05, **P < 0.01, ***P < 0.001, n.s., not significant

References

    1. Bray F, Laversanne M, Sung H, Ferlay J, Siegel RL, Soerjomataram I, Jemal A. Global cancer statistics 2022: GLOBOCAN estimates of incidence and mortality worldwide for 36 cancers in 185 countries. CA Cancer J Clin. 2024;74(3):229–63. - PubMed
    1. Zhang Z, Liu S, Wang Z, Wang S, Jiang L, Wang X, Li J, Shen L. Influential upregulation of KCNE4: propelling cancer associated fibroblasts-driven colorectal cancer progression. Cancer Cell Int. 2024;24(1):103. - PMC - PubMed
    1. Siegel RL, Wagle NS, Cercek A, Smith RA, Jemal A. Colorectal cancer statistics, 2023. CA Cancer J Clin. 2023;73(3):233–54. - PubMed
    1. Takahashi H, Berber E. Role of thermal ablation in the management of colorectal liver metastasis. Hepatobiliary Surg Nutr. 2020;9(1):49–58. - PMC - PubMed
    1. Tsilimigras DI, Brodt P, Clavien PA, Muschel RJ, D’Angelica MI, Endo I, Parks RW, Doyle M, de Santibañes E, Pawlik TM. Liver metastases. Nat Rev Dis Primers. 2021;7(1):27. - PubMed

MeSH terms

Substances

LinkOut - more resources