. 2025 Sep;48(9):6874-6896.
doi: 10.1111/pce.15649. Epub 2025 Jun 5.

A Group 6 LEA Protein Plays Key Roles in Tolerance to Water Deficit, and in Maintaining the Glassy State and Longevity of Seeds

Affiliations

A Group 6 LEA Protein Plays Key Roles in Tolerance to Water Deficit, and in Maintaining the Glassy State and Longevity of Seeds

Inti A Arroyo-Mosso et al. Plant Cell Environ. 2025 Sep.

Abstract

Plants have a wide range of adaptive and protective mechanisms to cope with dehydration. Central in these processes are the Late Embryogenesis Abundant (LEA) proteins, whose levels notably increase in response to dehydration during seed development and vegetative tissues. Understanding the function of LEA proteins is essential for gaining insights into plant development and their adjusting responses to environmental stress. This study focuses on Group 6 LEA proteins (LEA6) from Arabidopsis thaliana: AtLEA6-2.1, AtLEA6-2.2, and AtLEA6-2.3. Phylogenetic analysis reveals that LEA6 family emerged with seed plants, pointing to a unique role in seed viability. Functional characterization using T-DNA insertion mutants demonstrated that AtLEA6-2.1, but not AtLEA6-2.2, is essential for tolerance to high-osmolarity and salinity during germination and post-germination growth. AtLEA6-2.1 deficiency also altered root architecture under salinity, increasing primary root length while reducing lateral root number and length, suggesting a role in root development not described before for a LEA protein. Furthermore, AtLEA6-2.1 is critical for seed longevity, as mutants lacking this protein showed reduced germination after natural and accelerated aging. These mutants exhibited increased glass-former fragility, indicating that AtLEA6-2.1 deficiency reduces cellular viscosity, which we found correlates with reduced longevity. Our investigation extends to protective protein assays under dehydration, revealing that the acidic nature of this protein family requires specific conditions for its In Vitro protective activity. Overall, this study underscores the essential role of AtLEA6-2.1 in the plant response to low-water availability, seed longevity, and glassy state properties, making it a potential target for enhancing plant resilience to environmental challenges.

Keywords: Arabidopsis thaliana; LEA proteins; intrinsically disordered proteins; seed longevity; water deficit.


Conflict of interest statement

The authors declare no conflicts of interest.

Figures

Figure 1
Figure 1
Phylogeny of the LEA6 family explained by ancestral duplications. Proteins are colored according to the proposed ancestral duplication from which they derive: A (the original LEA6) in red, B in blue, C in green, and D in brown. The region labeled ‘B*’ shows three proteins from the Ericales order that originate from duplication B but are probably misplaced due to their association with the long branch of Ginkgo biloba (indicated with a purple star). The size of the grey dots on the internal nodes indicates branch support. Colors in the external circle indicate the taxonomic order to which the proteins belong, as shown in the left key color's legend. Supporting Information S1: Figure S1 shows paralogous proteins per species.
Figure 2
Figure 2
Multiple alignment of LEA6 proteins from various plant seed taxa showing the regions containing the conserved motifs. This alignment only includes the sequences of the conserved region found in most basal LEA6 protein identified in G. biloba and representatives from Amborellales and Nymphaeales (members of basal angiosperms), together with other LEA6 proteins of angiosperms. The upper part of the figure shows the distinctive motifs obtained by MEME analysis using all sequences as shown in Supporting Information S1: Figure S5. A representative consensus sequence and the corresponding amino acid abundance are shown at the bottom. A complete multiple alignment including all LEA6 sequences is shown in Supporting Information S1: Figure S5. [Color figure can be viewed at wileyonlinelibrary.com]
Figure 3
Figure 3
The structural disorder, isoelectric point, hydropathy, and molecular mass of 30,000 randomly selected proteins from Arabidopsis thaliana (grey dots) were compared against the plant LEA6 proteins (red dots) identified in this study. (a) The structural disorder of these proteins obtained by the IUPRED2A algorithm was plotted against their isoelectric point (pI). (b) The hydropathy of these proteins was plotted against their molecular mass. The values for pI and hydropathy of the proteins were obtained using the CIDER server. [Color figure can be viewed at wileyonlinelibrary.com]
Figure 4
Figure 4
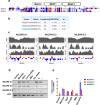
Sequence, physicochemical features, and transcript accumulation levels of Arabidopsis LEA6 proteins. (a) Multiple alignment of the amino acid sequences of the Arabidopsis LEA6 protein family. The alignment was colored using the Jalview (10.0.5) program to highlight the charge nature of their amino acid residues. Negative charged residues are indicated in blue, while those labeled in red correspond to the positive charged amino acid residues. (b) Amino acid number, molecular mass, and isoelectric point of Arabidopsis LEA6 protein family. (c) Graphs showing the net charge per residue (NCPR), the fraction of charged residues (FCR), the hydropathy, and the structural disorder (IUPRED) of AtLEA6 proteins. (d) Transcript accumulation patterns of Arabidopsis LEA6 family obtained by RT‐PCR. The growth conditions of the Arabidopsis seedlings from which the RNA was obtained is indicated in the upper part of this panel. Control: MS with no additions, Mannitol (300 mM), NaCl (200 mM), ABA (100 μM). For low humidity treatment, 7‐dag seedlings were transferred to a controlled humidity chamber (approx. 70% relative humidity) and collected after 24 h. Control corresponds to seedlings grown in MS medium under optimal conditions (see Materials and Methods). (−) RT‐PCR without DNA templates. (+) RT‐PCR using plasmid DNA containing AtLEA6 ORFs as templates. ABA, abscisic acid. (e) Transcript abundance was determined by densitometric analysis of agarose gel bands using ImageJ relative to eIF4 transcript abundance. [Color figure can be viewed at wileyonlinelibrary.com]
Figure 5
Figure 5
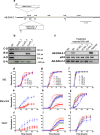
atlea6‐2.1 mutants are sensitive during germination under high osmolarity. (a) Representative scheme of the AtLEA6‐2.1 gene, indicating its corresponding transcript, including 5′ and 3′ UTRs (dashed boxes) and ORF (grey box). The localization of the oligonucleotides (arrows) and T‐DNA insertions are also shown. (b) PCR analysis to identify T‐DNA insertion sites and orientation in the different atlea6‐2.1 mutants. (c) End‐point RT‐PCR analysis to determine AtLEA6‐2.1 and AtLEA6‐2.2 transcript accumulation levels in atlea6‐2.1 mutants. eIF4 was used as loading reference. Plasmid: RT‐PCR using as template plasmid DNA containing AtLEA6 ORFs. (−) RT‐PCR without DNA. (d–l) Germination rate of wild‐type (Wt) and atlea6‐2.1 mutants. under optimal (d) and high osmolarity imposed with mannitol (e) and NaCl (f). Germination rate of complemented lines (g–i) and overexpressing (j–l) lines under optimal (g and j) and stress (h, k, i, and l) conditions. Germination was quantified by scoring radicle emergence using seeds from homozygous lines plated on MS medium (0.5×), or on MS added with mannitol (300 mM) or NaCl (200 mM). Seeds were stratified for 3 days and incubated in a growth chamber at 22°C. Error bars indicate SD of 3–5 replicates (n = 120–300), data were fit to a sigmoidal dose–response curve. Statistical analysis for germination rate is shown in Supporting Information S1: Figure S12. [Color figure can be viewed at wileyonlinelibrary.com]
Figure 6
Figure 6
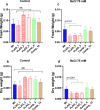
Seedlings (15 days after germination, dag) of atlea6‐2.1 mutants lines show sensitivity under NaCl treatment (FLAG_1, FLAG_2, FLAG_3) as compared to wild‐type line (Wt), and they are complemented by the wild‐type gene (Comp_4 and Comp_12). Five dag seedlings were transplanted to control medium (a and c) or to MS supplemented with 75 mM NaCl (b and d). Fresh (a and b) and dry weight (c and d) were recorded from seedlings collected 15 days after transfer (dat). Error bars indicate SD of 3–5 replicates (n = 24). GraphPad was used to calculate One‐Way ANOVA. Tukey post hoc test was used to evaluate statistical significance. The p‐value of only significant different comparisons is shown. The values for the different lines in (a and b) did not show significant differences as compared to Wt. p‐value > 0.05 are statistically not significant (ns). [Color figure can be viewed at wileyonlinelibrary.com]
Figure 7
Figure 7
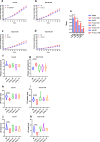
Primary root length kinetics of AtLEA6‐2.1 wild‐type and mutant (FLAG_1) lines of Arabidopsis seedlings grown in MS (a) or MS supplemented with NaCl: 50 mM (b), NaCl 75 mM (c), or NaCl 100 mM (d). The primary root kinetics was followed for 11 days after transplanting (11 dat). n = 23–27. Analysis was performed with data from three independent experiments. (e) Statistical analysis for primary root growth rate rate. GraphPad was used to calculate One‐Way ANOVA. Tukey post hoc test was used to evaluate statistical significance. (f–g) Primary root length of wild‐type (Wt), atlea6‐2.1 mutant (FLAG_1), and complemented (Comp_10, Comp_11, and Comp_13) seedlings grown under control (f) and NaCl conditions (75 mM) (g). Seedlings were sown in MS and transplanted at the second day to MS (f) or to MS supplemented with NaCl 75. mM (g). The primary root length was measured at 9 dat. (h and i) Lateral root (LR) number of seedlings transplanted to MS (h) or to MS supplemented with NaCl 75 mM (i). (j and k) Lateral root (LR) length of seedlings transplanted to MS (j) or to MS supplemented with NaCl 75 mM (k). Error bars indicate SD of six replicates (n = 24). GraphPad was used to calculate One‐Way ANOVA. Tukey post hoc test was used to evaluate statistical significance. See details in Section 2. p‐value > 0.05 are statistically not significant. The p‐value of only significant different comparisons are shown. [Color figure can be viewed at wileyonlinelibrary.com]
Figure 8
Figure 8
Seed longevity of wild‐type and atlea6‐2.1 mutant. (a) Germination rate under. optimal conditions of wild‐type and atlea6‐2.1 (FLAG_1) seeds stored during different periods in years, as indicated in the left legend. Each point corresponds to the mean germination of three independent replicates (n = 300). Error bars indicate SD. (b) Statistical analysis of germination rate using One‐Way ANOVA. Tukey post hoc test was used to evaluate statistical significance. (c) Accelerated aging test using seeds stored during different periods in months, as indicated at the bottom of the graph (n = 400), the upper dotted lines indicate the average final germination of both the wild‐type line (blue) and the mutant line (red) for all months. (d) Accelerated aging test of wild‐type, atlea6‐2.1 (FLAG_1) and three independent complemented lines (n = 150). The upper dotted lines indicate the average final germination of the wild‐type (blue), mutant (red), and complemented (green) lines. (e) Accelerated aging test of wild‐type, atlea6‐2.1 (FLAG_1) and three independent overexpression lines (n = 270–300). The upper dotted lines indicate the average final germination of the wild‐type (blue), mutant (red), and overexpression lines (brown). p‐value > 0.05 are statistically not significant. The p‐value of only significant different comparisons is shown. [Color figure can be viewed at wileyonlinelibrary.com]
Figure 9
Figure 9
Glassy properties of seeds from wild‐type (Wt), mutant (FLAG_1, FLAG_2, FLAG_3), and overexpression lines (OE_4, OE_6, and OE_8). (a) Retained water content of different seed lines, (b) glass transition temperature (Tg) midpoint values, and (c) glass former fragility (m‐index) values. (d) Plot of correlation between glass former fragility (m‐index) and germination capacity. Statistics were calculated using a one‐way ANOVA and Tukey post hoc test: p‐value > 0.05 are statistically not significant. Significant statistically values are shown in bar charts, error bars represent standard error (SD) and 95% confidence intervals (CI) in correlation plots. ns: nonsignificant. [Color figure can be viewed at wileyonlinelibrary.com]
Figure 10
Figure 10
Protection dehydration assays using LEA6 proteins. (a) Protection capacity of different LEA proteins under different pH conditions during In Vitro gradual dehydration. Protection was determined at 97% after gradual dehydration. (b) Protection capacity of different LEA proteins under different dehydration levels at pH 8. In this case, the maximum achieved dehydration was 99%. LDH was used as a reporter enzyme. LEA6 proteins used in these assays are indicated in the right legends. 10:1 (LEA:LDH) monomer molar ratios were used in all cases. Error bars of all panels indicate SD. Data from these experiments were obtained from three independent replicates. In A, lower letters indicate statistically significant differences. [Color figure can be viewed at wileyonlinelibrary.com]

References

    1. Acosta‐Maspons, A. , González‐Lemes I., and Covarrubias A. A.. 2019. “Improved Protocol for Isolation of High‐Quality Total RNA From Different Organs of Phaseolus vulgaris L.” Biotechniques 66, no. 2: 96–98. 10.2144/btn-2018-0129. - DOI - PubMed
    1. Angell, C. A. 1995. “The Old Problems of Glass and the Glass Transition, and the Many New Twists.” Proceedings of the National Academy of Sciences 92, no. 15: 6675–6682. 10.1073/pnas.92.15.6675. - DOI - PMC - PubMed
    1. Angell, C. A. 2002. “Liquid Fragility and the Glass Transition in Water and Aqueous Solutions.” Chemical Reviews 102, no. 8: 2627–2650. 10.1021/cr000689q. - DOI - PubMed
    1. Artur, M. A. S. , Zhao T., Ligterink W., Schranz E., and Hilhorst H. W. M.. 2019. “Dissecting the Genomic Diversification of Late Embryogenesis Abundant (LEA) Protein Gene Families in Plants.” Genome Biology and Evolution 11, no. 2: 459–471. 10.1093/gbe/evy248. - DOI - PMC - PubMed
    1. Ballesteros, D. , and Walters C.. 2019. “Solid‐State Biology and Seed Longevity: A Mechanical Analysis of Glasses in Pea and Soybean Embryonic Axes.” Frontiers in Plant Science 10: 920. 10.3389/fpls.2019.00920. - DOI - PMC - PubMed

LinkOut - more resources