

Parenclitic network mapping predicts survival in critically ill patients with sepsis
- PMID: 40474781
- PMCID: PMC12141926
- DOI: 10.14814/phy2.70407
Parenclitic network mapping predicts survival in critically ill patients with sepsis
Abstract
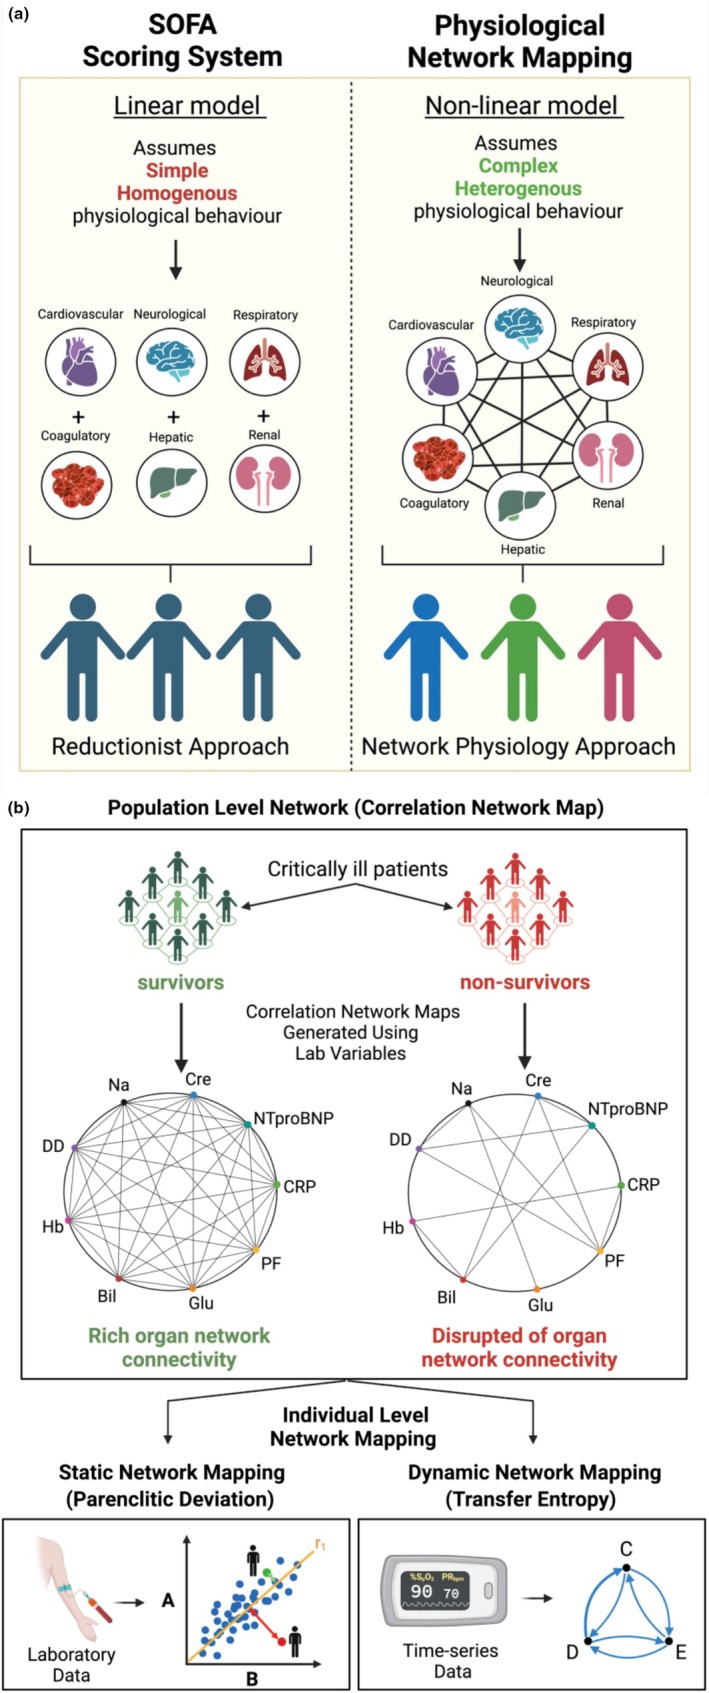
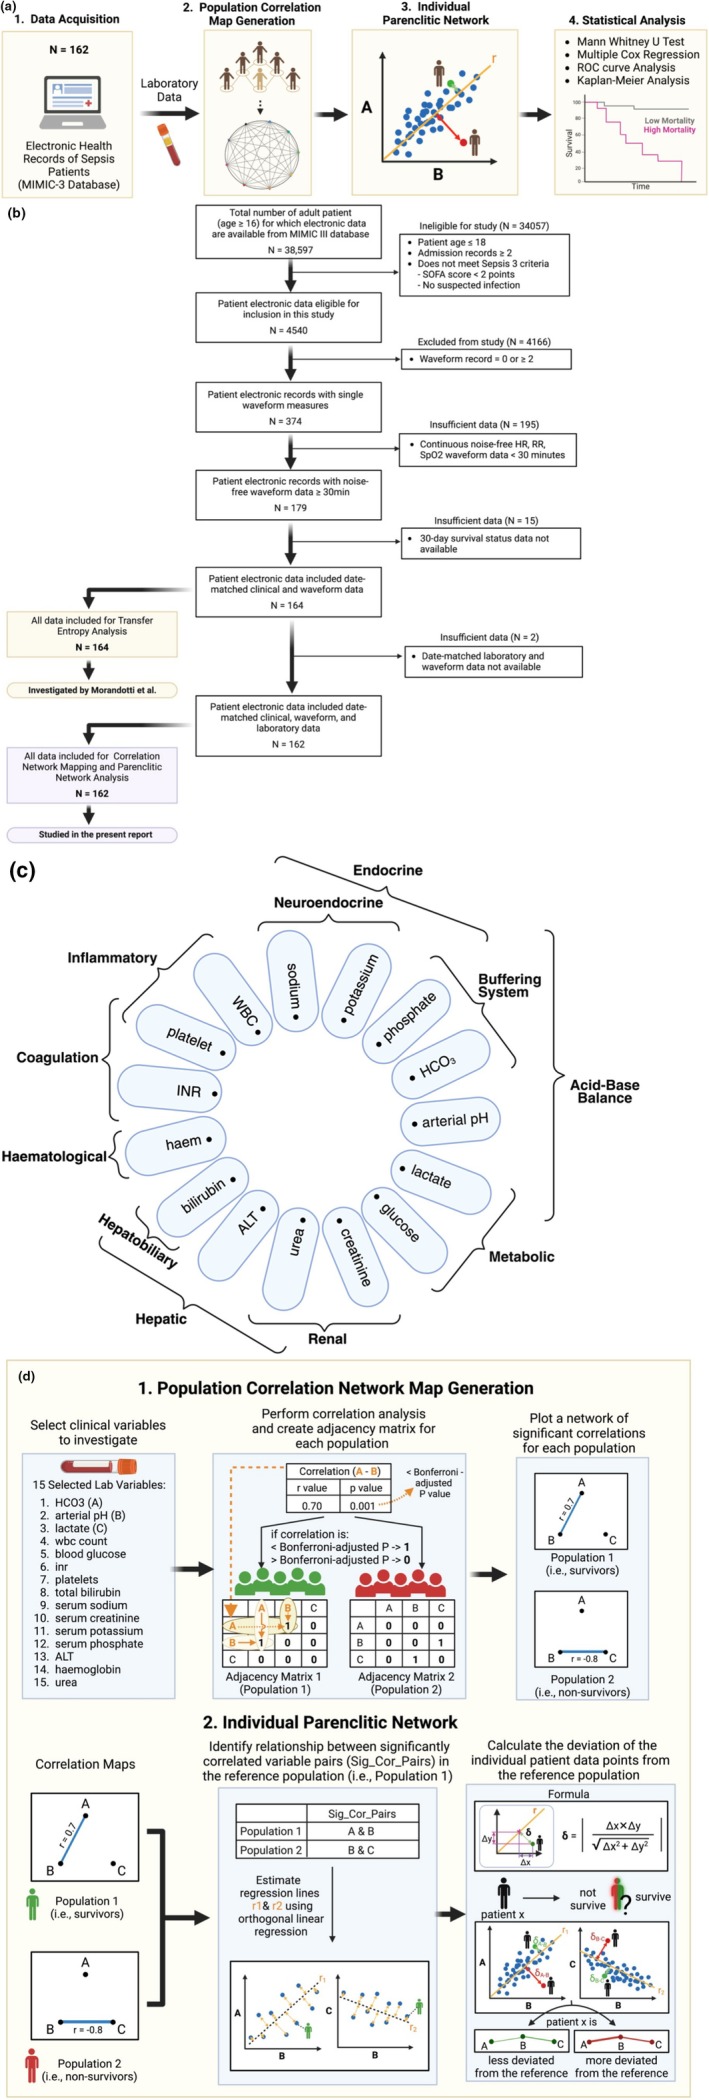
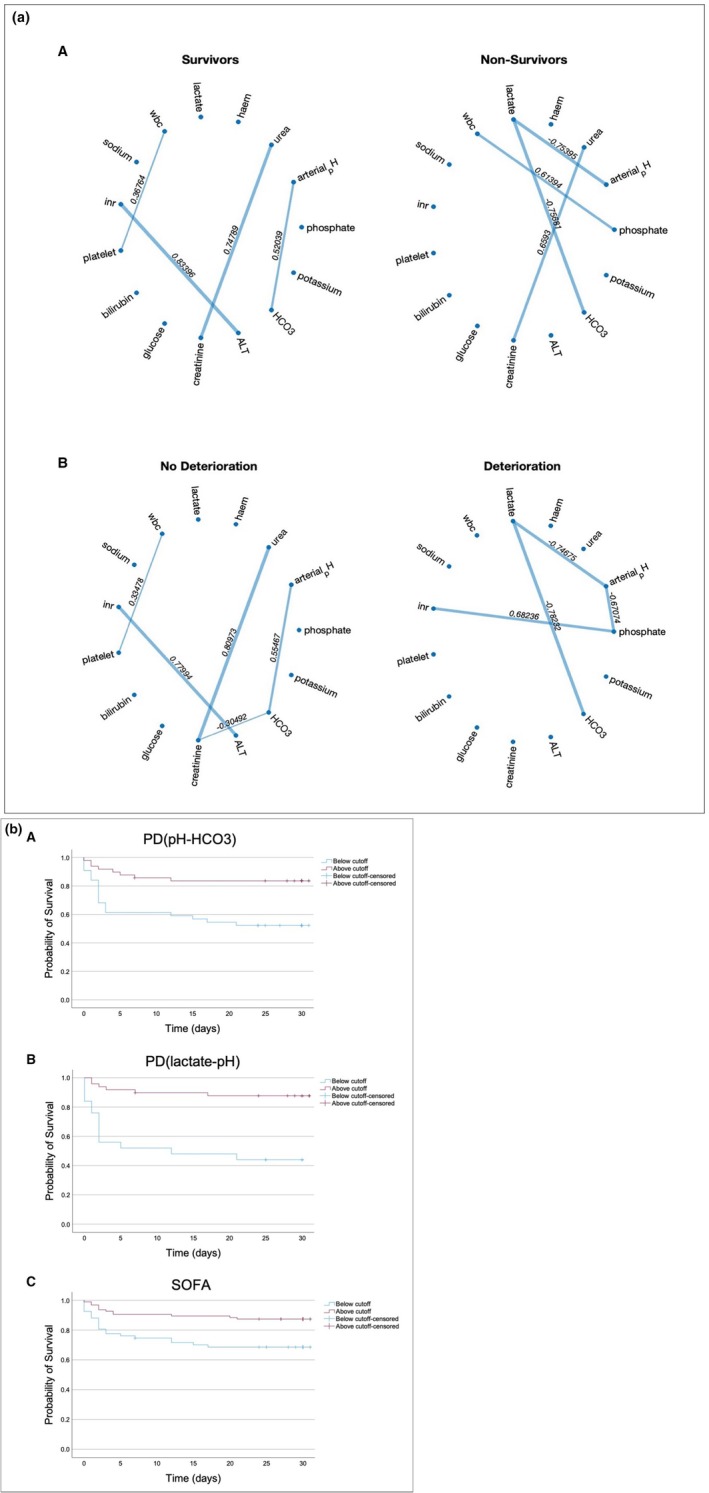
Sepsis is a complex disease involving multiple organ systems. A network physiology approach to sepsis may reveal collective system behaviors and intrinsic organ interactions. However, mapping functional connectivity for individual patients has been challenging due to the lack of analytical methods for evaluating physiological networks using routine clinical and laboratory data. This study explored the use of parenclitic network mapping to assess organ connectivity and predict sepsis outcomes based on routine laboratory data. Data from 162 sepsis patients meeting Sepsis-3 criteria were retrospectively analyzed from the MIMIC-III database. Fifteen physiological variables representing organ systems were used to construct organ network connectivity through correlation analysis. Correlation analysis identified 7 interactions linked to 30-day survival. Parenclitic network analysis was used to measure deviations in individual patients' correlations between organ systems from the reference physiological interactions observed in survivors. Parenclitic deviations in the pH-bicarbonate axis (hazard ratio = 2.081, p < 0.001) and pH-lactate axis (hazard ratio = 2.773, p = 0.024) significantly predicted 30-day mortality, independent of the Sequential Organ Failure Assessment (SOFA) score and ventilation status. This study highlights the potential of parenclitic network mapping to provide insights into sepsis pathophysiology and differences in organ system connectivity between survivors and non-survivors independent of sepsis severity and mechanical ventilation status.
Keywords: intensive care; network; network physiology; parenclitic; sepsis; survival.
© 2025 The Author(s). Physiological Reports published by Wiley Periodicals LLC on behalf of The Physiological Society and the American Physiological Society.
Conflict of interest statement
No conflicts of interest, financial, or otherwise, are declared by the authors.
Figures
Similar articles
-
Prognosis and Survival Modelling in Cirrhosis Using Parenclitic Networks.Front Netw Physiol. 2022 Feb 21;2:833119. doi: 10.3389/fnetp.2022.833119. eCollection 2022. Front Netw Physiol. 2022. PMID: 36926100 Free PMC article.
-
Decreased cardio-respiratory information transfer is associated with deterioration and a poor prognosis in critically ill patients with sepsis.J Appl Physiol (1985). 2025 Jan 1;138(1):289-300. doi: 10.1152/japplphysiol.00642.2024. Epub 2024 Dec 16. J Appl Physiol (1985). 2025. PMID: 39679499
-
Application of physiological network mapping in the prediction of survival in critically ill patients with acute liver failure.Sci Rep. 2024 Oct 9;14(1):23571. doi: 10.1038/s41598-024-74351-2. Sci Rep. 2024. PMID: 39384597 Free PMC article.
-
Adaptation and Validation of a Pediatric Sequential Organ Failure Assessment Score and Evaluation of the Sepsis-3 Definitions in Critically Ill Children.JAMA Pediatr. 2017 Oct 2;171(10):e172352. doi: 10.1001/jamapediatrics.2017.2352. Epub 2017 Oct 2. JAMA Pediatr. 2017. PMID: 28783810 Free PMC article.
-
Physiological network approach to prognosis in cirrhosis: A shifting paradigm.Physiol Rep. 2024 Jul;12(13):e16133. doi: 10.14814/phy2.16133. Physiol Rep. 2024. PMID: 38961593 Free PMC article. Review.
References
MeSH terms
LinkOut - more resources
Full Text Sources
Medical
