

TcMAC21 mouse model recapitulates abnormal vascular physiology observed in humans with Down syndrome
- PMID: 40474784
- PMCID: PMC12141928
- DOI: 10.14814/phy2.70384
TcMAC21 mouse model recapitulates abnormal vascular physiology observed in humans with Down syndrome
Abstract
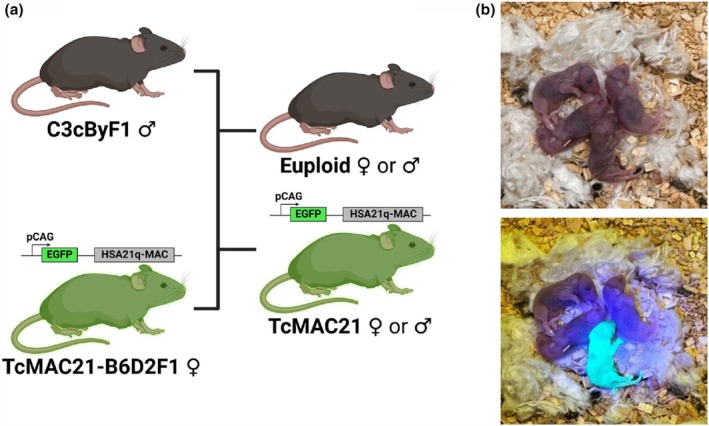
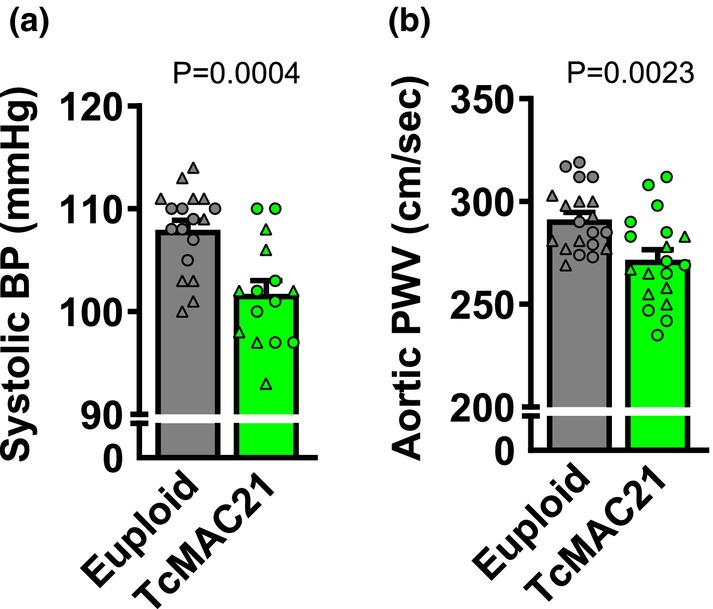
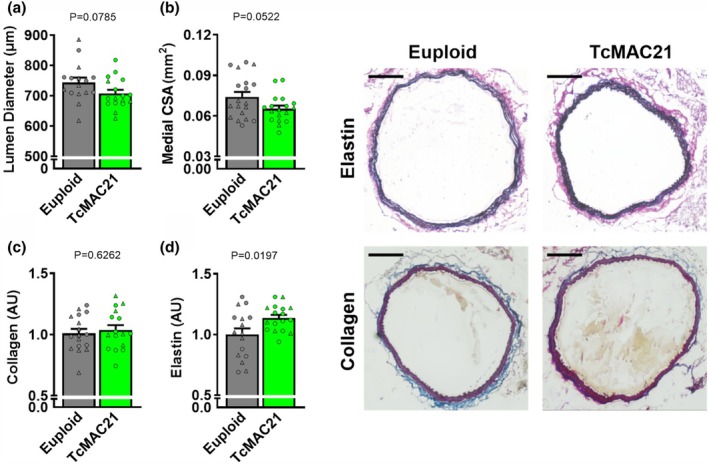
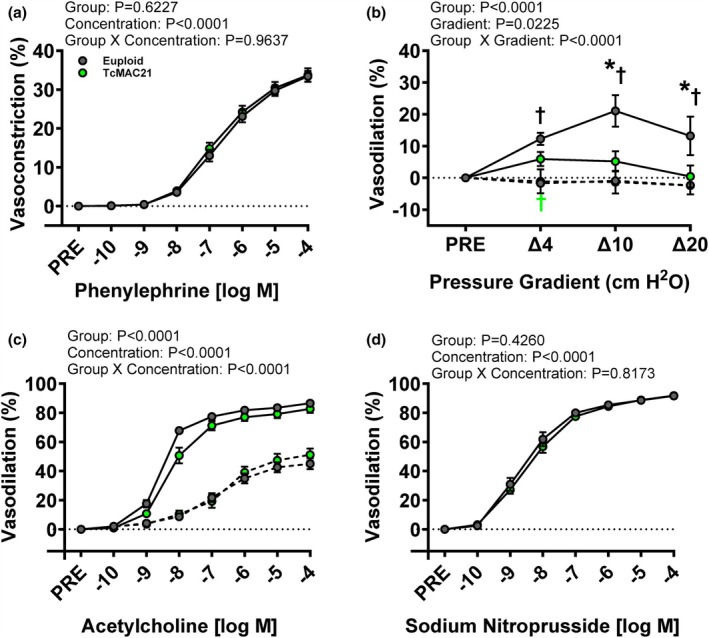
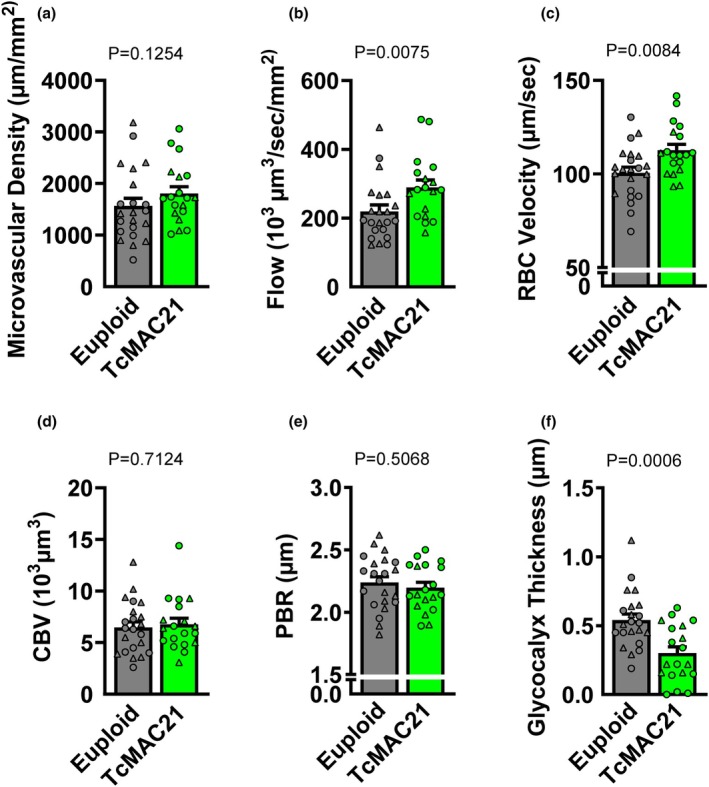
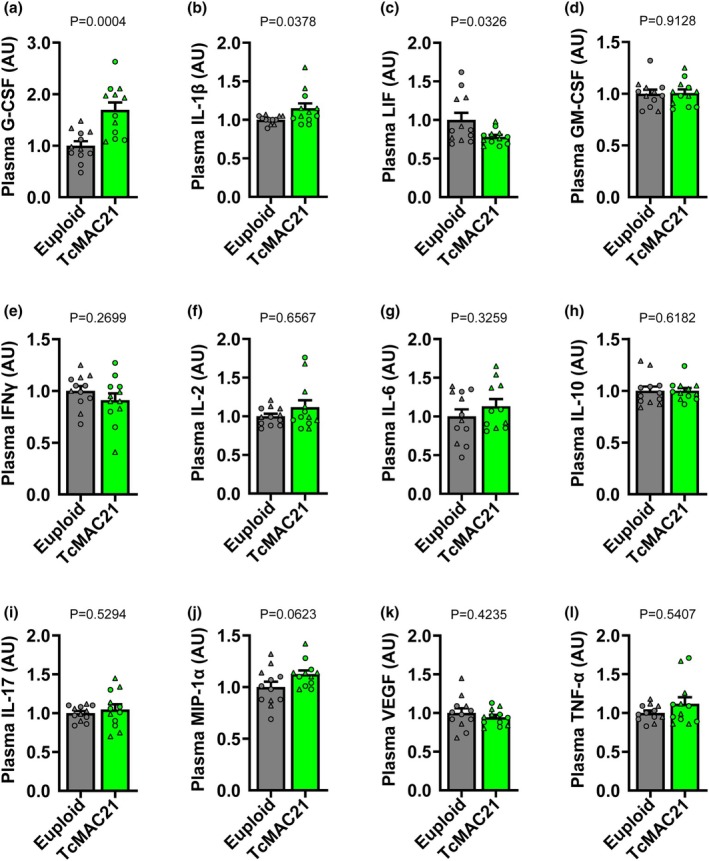
People with Down syndrome (DS) have abnormal vascular physiology, demonstrated by low systolic blood pressure (BP) and low aortic stiffness that are accompanied by endothelial dysfunction. The TcMAC21 mouse model of DS has many features observed in people with DS, although vascular physiology has not been studied. At 4 months old, male and female TcMAC21 mice exhibited lower systolic BP and aortic stiffness, as determined by aortic pulse wave velocity, which are accompanied by blunted carotid artery flow-mediated vasodilation, indicating endothelial dysfunction, compared to euploid (i.e., control) mice. To determine a potential mechanism for blunted flow-mediated vasodilation, we assessed endothelial glycocalyx properties, which mechanotransduces fluid shear stress to the endothelial cells, stimulating flow-mediated vasodilation. We observed a lower glycocalyx thickness in the mesenteric microcirculation of TcMAC21 mice. Vascular abnormalities in TcMAC21 mice were accompanied by systemic inflammation. This is the first study to examine vascular physiology in the TcMAC21 mouse model of DS and investigate glycocalyx properties in any model of DS, including humans. Taken together, these findings support the use of the TcMAC21 mouse model to study the vascular physiology in people with DS and may provide translational insight into the role of glycocalyx in vascular abnormalities in DS.
Keywords: aortic stiffness; blood pressure; endothelium; glycocalyx; trisomy 21.
© 2025 The Author(s). Physiological Reports published by Wiley Periodicals LLC on behalf of The Physiological Society and the American Physiological Society.
Conflict of interest statement
No conflicts of interest, financial or otherwise, are declared by the authors.
Figures
Similar articles
-
Increased propensity for infantile spasms and altered neocortical excitation-inhibition balance in a mouse model of down syndrome carrying human chromosome 21.Neurobiol Dis. 2023 Aug;184:106198. doi: 10.1016/j.nbd.2023.106198. Epub 2023 Jun 13. Neurobiol Dis. 2023. PMID: 37315904
-
Degradation of Glycocalyx and Multiple Manifestations of Endothelial Dysfunction Coincide in the Early Phase of Endothelial Dysfunction Before Atherosclerotic Plaque Development in Apolipoprotein E/Low-Density Lipoprotein Receptor-Deficient Mice.J Am Heart Assoc. 2019 Mar 19;8(6):e011171. doi: 10.1161/JAHA.118.011171. J Am Heart Assoc. 2019. PMID: 30866689 Free PMC article.
-
Impact of dietary supplementation of glycocalyx precursors on vascular function in type 2 diabetes.J Appl Physiol (1985). 2024 Dec 1;137(6):1592-1603. doi: 10.1152/japplphysiol.00651.2024. Epub 2024 Oct 31. J Appl Physiol (1985). 2024. PMID: 39480270 Free PMC article. Clinical Trial.
-
The role of the endothelial glycocalyx in advanced age and cardiovascular disease.Curr Opin Pharmacol. 2019 Apr;45:66-71. doi: 10.1016/j.coph.2019.04.011. Epub 2019 May 18. Curr Opin Pharmacol. 2019. PMID: 31112922 Free PMC article. Review.
-
Vascular endothelial injury exacerbates coronavirus disease 2019: The role of endothelial glycocalyx protection.Microcirculation. 2021 Apr;28(3):e12654. doi: 10.1111/micc.12654. Epub 2020 Aug 30. Microcirculation. 2021. PMID: 32791568 Free PMC article. Review.
References
-
- Agbaje, A. O. (2022). Arterial stiffness precedes hypertension and metabolic risks in youth: A review. Journal of Hypertension, 40, 1887–1896. - PubMed
-
- Bastianini, S. , Silvani, A. , Berteotti, C. , Lo Martire, V. , & Zoccoli, G. (2012). Mice show circadian rhythms of blood pressure during each wake‐sleep state. Chronobiology International, 29, 82–86. - PubMed
-
- Broers, C. J. , Gemke, R. J. , Weijerman, M. E. , van der Sluijs, K. F. , & van Furth, A. M. (2012). Increased pro‐inflammatory cytokine production in down syndrome children upon stimulation with live influenza a virus. Journal of Clinical Immunology, 32(2), 323–329. 10.1007/s10875-011-9625-4 - DOI - PubMed
MeSH terms
Grants and funding
LinkOut - more resources
Full Text Sources
Medical
