. 2025 Aug;24(8):e70125.
doi: 10.1111/acel.70125. Epub 2025 Jun 6.

Type-Specific Single-Neuron Analysis Reveals Mitochondrial DNA Maintenance Failure Affecting Atrophying Pontine Neurons Differentially in Lewy Body Dementia Syndromes

Affiliations

Type-Specific Single-Neuron Analysis Reveals Mitochondrial DNA Maintenance Failure Affecting Atrophying Pontine Neurons Differentially in Lewy Body Dementia Syndromes

Eloise J Stephenson et al. Aging Cell. 2025 Aug.

Abstract

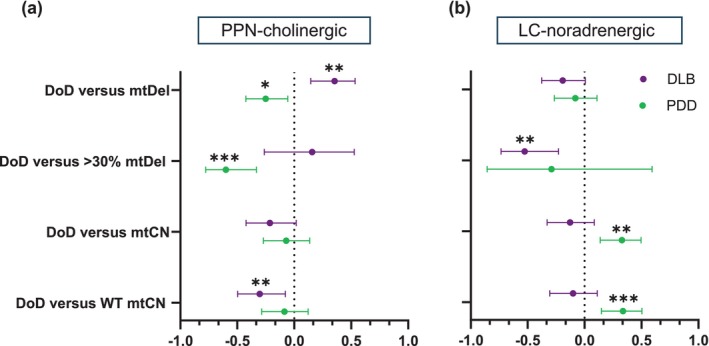
The age-associated neurodegenerative disorder, Lewy body dementia (LBD), encompasses neuropsychiatric symptom-overlapping Dementia with Lewy bodies (DLB) and Parkinson's Disease with Dementia (PDD). We characterised how differential mitochondrial DNA (mtDNA) profiles contribute to neurotype-specific neurodegeneration and thereby clinicopathological heterogeneity, between LBD's syndromes. We further characterised key nuclear-encoding genes' recalibrations in response to such mtDNA changes. In post-mortem 'single-cell' acetylcholine- and noradrenaline-producing neurons, respectively of the pedunculopontine nucleus (PPN) and locus coeruleus (LC) from DLB, PDD and neurological-control brains, we quantified 'major arc'-locating mtDNA deletions (mtDels) and -copy number (mtCN), and measured mRNA levels of nuclear-encoding genes regulating mtDNA maintenance, -biogenesis and mitophagy. DLB cases' OXPHOS defect instigating mtDel burden was higher in both neurotypes than PDD. In DLB, mtCN was reduced for both neurotypes, but PDD cases revealed mtDNA depletion in LC-noradrenergic neurons only. DLB patients' shorter survival correlated with PPN-cholinergic neurons' mtDel levels, inversely with wild-type mtCN, implying that such neurons' inability to maintain sufficient wild-type mtDNA content drive DLBs' rapid psycho-cognitive manifestations. Contrastingly, PDD's longer disease duration allowed compensation against mtDels' clonal expansion in PPN-cholinergic neurons. Moreover, PDD induced mRNA depletion of a mitochondrial genome maintenance gene in PPN-cholinergic neurons, whilst LC-noradrenergic neurons displayed reduced expression of a mitophagy regulating gene. Here we identify mitochondrial genome maintenance and mitophagy pathway enrichment as therapeutic targets to offset defective mtDNA within pontine cholinergic and noradrenergic neurons of PDD patients. The pronounced LBD subtype-related mitochondria-nuclear genetic differences question the consensus that pathology converges at disease end-stage, calling for LBD subtype and neurotype-specific therapeutics.

Keywords: Lewy body dementia; brainstem; cholinergic neurons; mitochondrial DNA; noradrenergic neurons; nuclear gene transcriptomic responses.


Conflict of interest statement

The authors declare no conflicts of interest.

Figures

FIGURE 1
FIGURE 1
mtDel load characterises PPN‐cholinergic neurons of both LBD subtypes but mtCN change is DLB‐specific. (a) Neurotype‐specific single cell analysis revealed that DLB and PDD‐affected cholinergic PPN neurons harbour significantly greater mtDel burden compared to neurological‐control post‐mortem neurons (**p < 0.001). (b) A data scatter plot reveals how individual neurons from both LBD cohorts frequently surpassed the 60% threshold for inducing mitochondrial dysfunction, compared to control cases (***p < 0.0001). Marginally more (8%) DLB than PDD‐affected PPN‐cholinergic neurons harboured > 60% mtDel levels. (c) Total mtCN was depleted in DLB‐affected neurons compared to PDD ones (*p < 0.05), where mtCN was maintained (versus control; p > 0.05). (d) Dots indicate mtCN data points for individual neurons; value ranges: 67–32,341 (controls), 99–21,182 (DLB) and 30–41,902 (PDD). (e) A data figure showing the triad of measures for drawing these conclusions: Total mtCN, WT mtCN and mtDel‐harbouring mtCN. WT mtDNA was maintained in PPD but not in DLB. (f) Correlative analysis revealed a decline in total mtCN as mtDel % increased, reaching statistical significance for PDD (***p < 0.001). We previously reported a similar effect for PPN‐cholinergic neurons in post‐mortem PD biopsies (Bury et al. 2017). (g) The notion that WT mtCN is a better metric of a cell's OXPHOS capacity than mtDel levels is gaining traction. Correlative analysis which included WT mtCN as a factor revealed an attempt to maintain WT mtCN in at least some PPN‐cholinergic neurons for both DLB (**p < 0.01) and PDD cases (***p < 0.001). Few neurons linearly expressed concomitant WT mtCN and mtDel increases in DLB. Thus, the LBD subtype's disease mechanism seemingly co‐depends on the neuronal pool attempting ‘maintenance of mtDNA wild‐type’ for survival such neurons, the latter being inversely affected by DLB's relatively short DoD. Each dot represents values obtained for (b) mtDel and (d) mtCN measurements per individual neuron.
FIGURE 2
FIGURE 2
LBD subtypes non‐discriminate mtCN depletion but mtDel increased in DLB LC‐noradrenergic neurons only. (a) Compared to neurological controls, LC‐noradrenergic single‐cell analysis revealed that only DLB‐affected neurons harbour significantly greater mtDel load (*p < 0.05); PDD‐affected neurons held few mtDels (****p < 0.0001). (b) A data scatter plot corroborates this result, revealing that 22 out of 98 (22%) individual DLB neurons surpassed the OXPHOS deficiency threshold. Only 2 out of 108 (2%) PDD‐affected neurons were > 60% mtDels, less than seen in control cases (5%). (c) mtCN depletion affected both DLB (***p < 0.001) and PDD patients (****p < 0.0001) in this neurotype compared to control cases; the reduction was most pronounced in PDD (43% lower compared to DLB). (d) mtCN data points for individual neurons are indicated by dots. Similar to PPN‐cholinergic neuronal values, LC‐noradrenergic values ranged significantly: 40–99,160 for control, 47–111,960 for DLB, and 58–172,532 for PDD. (e) The data stratified as total mtCN, WT mtCN and mtCN harbouring mtDels suggests the noradrenergic neurons' inability to maintain WT mtDNA when affected by either DLB or PDD. This also reveals that the near absence of mtDel levels coupled with severe mtCN depletion are striking features of this pontine neuronal type in PDD patients. (f) A correlation analysis comparing total mtCN against mtDels (%) revealed a reduction in overall mtDNA content as mtDNA levels (%) increased for both control (*p < 0.05) and DLB (***p < 0.001). (g) When the variables of interest were WT mtCN, critical for maintaining cellular homeostasis and absolute mtDel levels, results revealed a rise in WT mtCN due to increased single‐neuronal mtDels in both control (****p < 0.0001) and DLB cases (****p < 0.0001). This relationship was absent in PDD‐affected neurons, potentially due to very low mtCN and mtDels which characterised LC NA neurons of this cohort. Each dot represents values obtained for (b) mtDel and (d) mtCN measurements per individual neuron.
FIGURE 3
FIGURE 3
Correlative mtDNA‐DoD for both pontine neurotypes‐of‐interest in LBD subtypes. (a) When considering PPN‐cholinergic neurons, mtDels showed a significant positive relationship with DoD in DLB (r = 0.3546, **p < 0.01), but the correlation was negative in PDD (−r = 0.2502, *p < 0.05). A strong negative relationship was seen for neurons with > 30% mtDels and DoD in PDD (r = −0.599, ***p < 0.001). WT mtCN correlated negatively with DoD in DLB (r = −0.3026, **p < 0.01). (b) Within single LC‐noradrenergic neurons, no significant correlation was seen in either disease cohort between mtDels (%) and DoD, but a significant negative relationship was detected in DLB between mtDel levels with pathogenic potential (> 30%) and DoD (r = −0.5262, **p < 0.01). In PDD, mtCN correlated highly positively with DoD (r = 0.3279, **p < 0.01), revealing an even stronger positive correlation with WT mtCN (r = 0.339, ***p < 0.001).
FIGURE 4
FIGURE 4
Violin plots to reveal comparative median expression levels of nuclear‐encoded genes intended for maintaining mtDNA stability. (a) Comparative analysis revealed significantly decreased TFAM expression in PPN‐cholinergic neurons of the PDD cohort (median: 762; lower quartile (LQ): 394; upper quartile (UQ): 1215) compared to both DLB (median: 947; LQ: 654; UQ: 2620; *p < 0.05) and control cases (median: 1138; LQ: 506; UQ: 2099; *p < 0.05). (b) In comparison, no significant median TFAM mRNA level changes were discerned between the cohorts in LC‐noradrenergic neurons. (c) Median PGC1α mRNA levels were highly similar (p > 0.05) between the cohorts when measured in PPN‐cholinergic, (d) and LC‐noradrenergic neurons. (e) This contrasted with the absence of notable PPN‐cholinergic PINK1 expression level differences between the cohorts (p > 0.05), (f) such mRNA expression was severely depleted within LC‐noradrenergic neurons of PDD cases (median: 227; LQ: 155; UQ: 507; **p < 0.01) compared to both DLB (median: 227; LQ: 155; UQ: 507) and control cases (median: 651; LQ: 192; UQ: 1743).
FIGURE 5
FIGURE 5
mtDNA‐regulating genes' mRNA levels and disease course metric correlations in pontine cholinergic and noradrenergic neurons. Bivariate Pearson's correlation analysis was applied to single (a) PPN‐cholinergic and (b) LC‐noradrenergic neurons to interrogate the relationship between AaD and DoD and the mRNA levels of three genes. The dot intersecting each summary line indicates the r‐value, whilst the parallel bars visually represent the level of uncertainty relating to this correlation coefficient value. Positive correlation effects transcend towards the right of the perforated central line, whilst a negative correlation transcends towards the left. (a) TFAM expression levels exhibited a marginally significant positive relationship with AaD (r = 0.2828, *p < 0.05) in the DLB cohort. PGC1α demonstrated a significant negative correlation with this variable in the control (r = −0.3905, **p < 0.05) and PDD groups; there was a marginal positive relationship (r = 0.272, *p < 0.05). Only DLB cases showed a significant positive association between PINK1 levels and AaD (r = 0.312, *p < 0.05). No significant connections were seen between the gene expression data and DoD for PDD in this neurotype. However, DLB cases showed a TFAM‐DoD positive correlation (r = 0.299, *p < 0.05) whilst a PGC1α‐DoD correlation (r = 0.6085, ****p < 0.0001) was especially significant. (b) Within single LC‐noradrenergic neurons, the TFAM expression levels exhibited a marginally significant positive relationship with AaD in the control cohort (r = 0.3215, *p < 0.05), with a stronger negative relationship in DLB cases (r = −0.4, **p < 0.01). No significant associations were detected between the targeted genes and DoD in either disease cohort.
FIGURE 6
FIGURE 6
Summary of the current mtDNA variance and key nuclear‐encoded mtDNA regulating genes expression profile results. Arrows indicate the direction of change, the size depicting the degree of change observed in the patient cohorts, relative to neurological control patients.

References

    1. Aarsland, D. , Ballard C., Larsen J. P., and McKeith I.. 2001. “A Comparative Study of Psychiatric Symptoms in Dementia With Lewy Bodies and Parkinson's Disease With and Without Dementia.” International Journal of Geriatric Psychiatry 16: 528–536. - PubMed
    1. Aarsland, D. , Litvan I., Salmon D., Galasko D., Wentzel‐Larsen T., and Larsen J. P.. 2003. “Performance on the Dementia Rating Scale in Parkinson's Disease With Dementia and Dementia With Lewy Bodies: Comparison With Progressive Supranuclear Palsy and Alzheimer's Disease.” Journal of Neurology, Neurosurgery, and Psychiatry 74: 1215–1220. - PMC - PubMed
    1. Aarsland, D. , Perry R., Larsen J. P., et al. 2005. “Neuroleptic Sensitivity in Parkinson's Disease and Parkinsonian Dementias.” Journal of Clinical Psychiatry 66: 633–637. - PubMed
    1. Alessandro, S. , Ceravolo R., Brusa L., et al. 2010. “Non‐Motor Functions in Parkinsonian Patients Implanted in the Pedunculopontine Nucleus: Focus on Sleep and Cognitive Domains.” Journal of the Neurological Sciences 289: 44–48. - PubMed
    1. Ali, A. T. , Boehme L., Carbajosa G., Seitan V. C., Small K. S., and Hodgkinson A.. 2019. “Nuclear Genetic Regulation of the Human Mitochondrial Transcriptome.” eLife 8: e41927. - PMC - PubMed

Substances