

Imaging biomineralizing bacteria in their native-state with X-ray fluorescence microscopy
- PMID: 40474954
- PMCID: PMC12135071
- DOI: 10.1039/d4sc08375j
Imaging biomineralizing bacteria in their native-state with X-ray fluorescence microscopy
Abstract
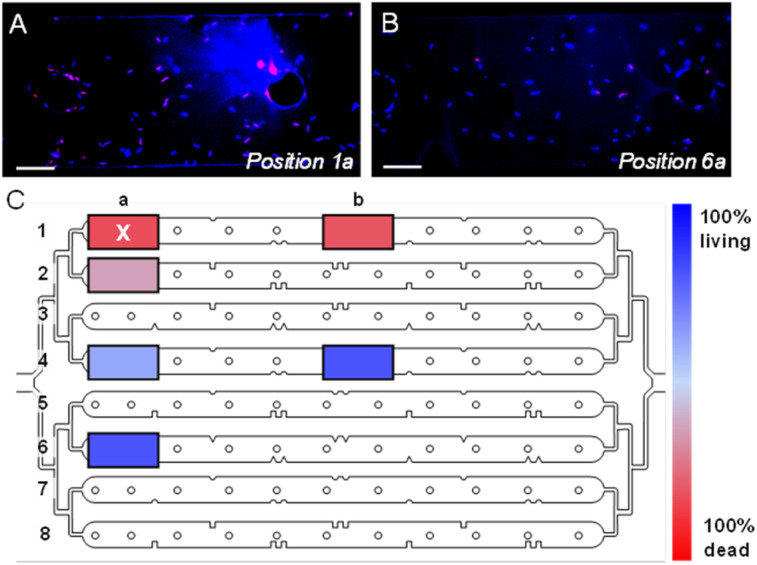
Understanding the interactions between metal-based nanoparticles and biological systems in complex environments (e.g., the human body, soils, and marine settings) remains challenging, especially at single-cell and nanoscale levels. Capturing the dynamics of these interactions, such as metal distribution, nanoparticle growth, or degradation, in their native state (in vivo) is particularly difficult. Here, we demonstrate the direct measurement of iron content in hydrated, magnetite-biomineralizing magnetotactic bacteria using synchrotron-based nanobeam-scanning X-ray fluorescence microscopy combined with a liquid cell environment. In addition to X-ray fluorescence imaging, we collected iron chemical speciation information from individual bacteria in liquid using X-ray absorption spectroscopy. To follow biomineralization in situ, we developed a microfluidic device to track magnetite nanoparticle formation over several hours under the X-ray beam. This approach highlights the potential of X-ray fluorescence microscopy in liquid cell setups to provide elemental and chemical insights into biological processes at the single-cell level. Combining X-ray nanobeam techniques with liquid cell devices will enable more "on-chip" experiments on metals in biological contexts to be conducted at the synchrotron.
This journal is © The Royal Society of Chemistry.
Conflict of interest statement
There are no conflicts to declare.
Figures


Similar articles
-
Nanobeam-scanning X-ray fluorescence microscopy reveals the elemental composition of dense intracellular bodies in biomineralizing coccolithophores.Faraday Discuss. 2025 Sep 11;261(0):251-268. doi: 10.1039/d5fd00021a. Faraday Discuss. 2025. PMID: 40452609
-
Leveraging a foundation model zoo for cell similarity search in oncological microscopy across devices.Front Oncol. 2025 Jun 18;15:1480384. doi: 10.3389/fonc.2025.1480384. eCollection 2025. Front Oncol. 2025. PMID: 40606969 Free PMC article.
-
Novel application of metabolic imaging of early embryos using a light-sheet on-a-chip device: a proof-of-concept study.Hum Reprod. 2025 Jan 1;40(1):41-55. doi: 10.1093/humrep/deae249. Hum Reprod. 2025. PMID: 39521726 Free PMC article.
-
Systemic pharmacological treatments for chronic plaque psoriasis: a network meta-analysis.Cochrane Database Syst Rev. 2021 Apr 19;4(4):CD011535. doi: 10.1002/14651858.CD011535.pub4. Cochrane Database Syst Rev. 2021. Update in: Cochrane Database Syst Rev. 2022 May 23;5:CD011535. doi: 10.1002/14651858.CD011535.pub5. PMID: 33871055 Free PMC article. Updated.
-
Bioengineered nerve conduits and wraps for peripheral nerve repair of the upper limb.Cochrane Database Syst Rev. 2022 Dec 7;12(12):CD012574. doi: 10.1002/14651858.CD012574.pub2. Cochrane Database Syst Rev. 2022. PMID: 36477774 Free PMC article.
References
-
- Sanchez-Cano C. Alvarez-Puebla R. A. Abendroth J. M. Beck T. Blick R. Cao Y. Caruso F. Chakraborty I. Chapman H. N. Chen C. Cohen B. E. Conceição A. L. C. Cormode D. P. Cui D. Dawson K. A. Falkenberg G. Fan C. Feliu N. Gao M. Gargioni E. Glüer C.-C. Grüner F. Hassan M. Hu Y. Huang Y. Huber S. Huse N. Kang Y. Khademhosseini A. Keller T. F. Körnig C. Kotov N. A. Koziej D. Liang X.-J. Liu B. Liu S. Liu Y. Liu Z. Liz-Marzán L. M. Ma X. Machicote A. Maison W. Mancuso A. P. Megahed S. Nickel B. Otto F. Palencia C. Pascarelli S. Pearson A. Peñate-Medina O. Qi B. Rädler J. Richardson J. J. Rosenhahn A. Rothkamm K. Rübhausen M. Sanyal M. K. Schaak R. E. Schlemmer H.-P. Schmidt M. Schmutzler O. Schotten T. Schulz F. Sood A. K. Spiers K. M. Staufer T. Stemer D. M. Stierle A. Sun X. Tsakanova G. Weiss P. S. Weller H. Westermeier F. Xu M. Yan H. Zeng Y. Zhao Y. Zhao Y. Zhu D. Zhu Y. Parak W. J. ACS Nano. 2021;15:3754–3807. doi: 10.1021/acsnano.0c09563. - DOI - PMC - PubMed
-
- Mino L. Borfecchia E. Segura-Ruiz J. Giannini C. Martinez-Criado G. Lamberti C. Rev. Mod. Phys. 2018;90:025007. doi: 10.1103/RevModPhys.90.025007. - DOI
LinkOut - more resources
Full Text Sources