[Preprint]. 2025 May 25:2025.05.20.655194.
doi: 10.1101/2025.05.20.655194.

Marginal zone and follicular B cells respond differently to TLR4 and TLR9 stimulation

Affiliations

Marginal zone and follicular B cells respond differently to TLR4 and TLR9 stimulation

Himani Makkar et al. bioRxiv. .

Abstract

Marginal zone (MZ) B cells are considered to be innate-like immune cells, and follicular (FO) B cells are considered to be adaptive immune B cells. Yet, the proliferative response of MZ and FO B cells to different innate stimuli remains unclear. Here, we investigated cell growth, division, and death to determine the collective proliferative response of MZ and FO B cells in response to innate stimuli, LPS and CpG. We show that the growth rate of FO B cells is higher than that of MZ B cells in response to CpG, though MZ B cells acquire a higher mass at division, whereas both the growth rate and mass at division for MZ and FO B cells remain similar in response to LPS stimulation. We show that MZ B cells divide faster and induce a higher cRel expression in response to both CpG and LPS stimulation than FO B cells. A higher proportion of MZ B cells enter first division in response to LPS stimulation, not in response to CpG stimulation, than FO B cells. Interestingly, CpG stimulation, not LPS stimulation, leads to higher cell death in MZ B cells than FO B cells. In response to LPS stimulation, MZ B cells show a higher cell number at early time and a reduced/similar cell number at late time, whereas in response to CpG stimulation, MZ B cells show a lower cell number at both early and late time. Our study suggests that LPS and CpG stimulation impact cell growth, division, and death differently, which in turn regulate different proliferative responses of MZ and FO B cells. Thus, our study offers a new perspective that different innate stimuli regulate different features of proliferative responses.

Keywords: B cell; Toll-like receptor; microscopy; proliferation.


Conflict of interest statement

Conflicts of interest There are no conflicts of interest to declare.

Figures
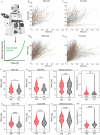
Figure 1:
Figure 1:. Differential growth of MZ and FO B cells.
A) Schematic of time-lapse quantitative phase imaging to measure cell mass. Mass accumulation follows exponential growth for dividing cell. B) + C) Cell growth trajectories of LPS-stimulated MZ and FO B cells follow an exponential growth. The X-axis represents time in hours, and the Y-axis represents cell mass in picograms (pg). D) + E) Cell growth trajectories of CpG-stimulated MZ and FO B cells follow an exponential growth. F) + H) Violin plot of LPS-stimulated MZ and FO B cells mass at 16 h and 24 h. Cell mass is expressed in pg. The MZ and FO B cells are represented by red and black violin plots, respectively. G) + I) Violin plot of CpG-stimulated MZ and FO B cells mass at 16 h and 24 h. J) Violin plot of LPS-stimulated MZ and FO B cells mass at division. K) Violin plot of CpG-stimulated MZ and FO B cells mass at division. L) Violin plot of LPS-stimulated MZ and FO B cells growth rate (pg per h). K) Violin plot of CpG-stimulated MZ and FO B cells growth rate (pg per h). In all plots, the mean is indicated at the bottom of each group. *p < 0.05, **p < 0.01, ***p < 0.001, and not significant, ns (unpaired Student’s t test).
Figure 2:
Figure 2:. Faster division of MZ B cells is correlated with cRel expression.
A) + B) Cell Trace Far Red (CTFR) histogram of MZ and FO B cells at 24 h and 48 h following stimulation with LPS. Data shown are representative of 3 biological replicates. The X-axis represents the dilution of CTFR, and the Y-axis represents the histogram, normalized to the mode. C) Distribution of first division time (Tdiv0) of MZ (upper panel) and FO (upper panel) B cells stimulated with LPS were analyzed using FlowMax, running Fcyton model to predict Tdiv0. Data shown are representative of 3 biological replicates. D) Bar graph shows the estimated Tdiv0 of MZ and FO B cells stimulated with LPS. E) + F) CTFR histogram of MZ and FO B cells at 72 h and 96 h following stimulation with CpG. Data shown are representative of 3 biological replicates. The X-axis is the dilution of CTFR, and the Y-axis is the histogram normalized to mode. G) Distribution Tdiv0 of MZ (upper panel) and FO (upper panel) B cells stimulated with CpG were analyzed using FlowMax, running Fcyton model to predict Tdiv0. Data shown are representative of 3 biological replicates. H) Bar graph shows the estimated Tdiv0 of MZ and FO B cells stimulated with CpG. I) Total cellular cRel fluorescence histogram between MZ (dark red) and FO (dark black) B cells without stimulation (0 h). Background fluorescence of MZ and FO B cells are shown by light red and light black color. For background fluorescence, MZ and FO B cells were isolated C57BL/6 mice expressing cRel without mTFP1 knock-in. Data shown are representative of 3 biological replicates. J) + K) Total cellular cRel fluorescence histogram between MZ (dark red) and FO (dark black) B cells stimulated with LPS for 14 h and 24 h. L) + M) Total cellular cRel fluorescence histogram between MZ (dark red) and FO (dark black) B cells stimulated with CpG for 14 h and 24 h. The number of dots in each plot is the number of replicates. In all plots, the mean is indicated at the bottom of each group. *p < 0.05, **p < 0.01, ***p < 0.001, and not significant, ns (unpaired Student’s t test).
Figure 3:
Figure 3:. Sustained proliferation of FO B cells upon TLR4 and TLR9 stimulation.
A) + B) CTFR histogram of MZ and FO B cells at 72 h and 96 h following stimulation with LPS. The X-axis is the dilution of CTFR, and the Y-axis is cell counts. C) Normalize cell number of MZ and FO B cells at 24 h, 48 h, 72 h and 96 h of three replicates. Normalized cell number is calculated by the cell number at a particular time/seeding cell number at 0 h. The X-axis is time in hours, and the Y-axis is normalized cell number. D) + E) Dead cells proportion of MZ and FO B cells following stimulation with LPS for 48 h. The X-axis is 7AAD, and the Y-axis is forward scattered area. Data shown are representative of 3 biological replicates. F) Bar graph shows fold change of dead cell between MZ and FO B cells stimulated with LPS for 48 h. Fold change is calculated by % of dead cells in MZ/FO. G) Bar graph shows the predicted proportion of cells entering 1st division cycle in MZ and FO B cells stimulated with LPS and data were analyzed using FlowMax, running Fcyton model. H) + I) CTFR histogram of MZ and FO B cells at 72 h and 96 h following stimulation with CpG. The X-axis is the dilution of CTFR, and the Y-axis is cell counts. J) Normalize cell number of MZ and FO B cells at 24 h, 48 h, 72 h and 96 h of three replicates. Normalize cell number is calculated by the cell number at a particular time/seeding cell number at 0 h. The X-axis is time in hours, and the Y-axis is normalized cell number. K) + L) Dead cells proportion of MZ and FO B cells following stimulation with CpG for 48 h. The X-axis is 7AAD, and the Y-axis is forward scattered area. Data shown are representative of 3 biological replicates. F) Bar graph shows fold change of dead cells between MZ and FO B cells stimulated with CpG for 48 h. Fold change is calculated by % of dead cells in MZ/FO. G) Bar graph shows the predicted proportion of cells entering 1st division cycle in MZ and FO B cells stimulated with CpG and data were analyzed using FlowMax, running Fcyton model. The number of dots in each plot is the number of replicates. In all plots, the mean is indicated at the bottom of each group. *p < 0.05, **p < 0.01, ***p < 0.001, and not significant, ns (unpaired Student’s t test).

References

    1. Cerutti A., Cols M., and Puga I.. 2013. Marginal zone B cells: virtues of innate-like antibody-producing lymphocytes. Nat Rev Immunol 13: 118–132. - PMC - PubMed
    1. Marongiu L., Gornati L., Artuso I., Zanoni I., and Granucci F.. 2019. Below the surface: The inner lives of TLR4 and TLR9. J Leukoc Biol 106: 147–160. - PMC - PubMed
    1. Pillai S., and Cariappa A.. 2009. The follicular versus marginal zone B lymphocyte cell fate decision. Nat Rev Immunol 9: 767–777. - PubMed
    1. Gaudette B. T., Roman C. J., Ochoa T. A., Gomez Atria D., Jones D. D., Siebel C. W., Maillard I., and Allman D.. 2021. Resting innate-like B cells leverage sustained Notch2/mTORC1 signaling to achieve rapid and mitosis-independent plasma cell differentiation. J Clin Invest 131. - PMC - PubMed
    1. Genestier L., Taillardet M., Mondiere P., Gheit H., Bella C., and Defrance T.. 2007. TLR agonists selectively promote terminal plasma cell differentiation of B cell subsets specialized in thymus-independent responses. J Immunol 178: 7779–7786. - PubMed

Publication types

LinkOut - more resources