[Preprint]. 2025 May 24:2025.05.20.655210.
doi: 10.1101/2025.05.20.655210.

Integrating Single-Cell Biophysical and Transcriptomic Features to Resolve Functional Heterogeneity in Mantle Cell Lymphoma

Affiliations

Integrating Single-Cell Biophysical and Transcriptomic Features to Resolve Functional Heterogeneity in Mantle Cell Lymphoma

Ye Zhang et al. bioRxiv. .

Abstract

Intra-tumor heterogeneity impacts disease progression and therapeutic resistance but remains poorly characterized by conventional histologic, immunophenotypic, and molecular approaches. Single-cell biophysical properties distinguish functional phenotypes complementary to these approaches, providing additional insight into cellular diversity. Here we link both buoyant mass and stiffness to gene expression to identify clinically relevant phenotypes within primary mantle cell lymphoma (MCL) cells, employing MCL as a model of biological and clinical diversity in human cancer. Linked measurements reveal that buoyant mass and stiffness characterize B-cell development states from naïve to plasma cell and correlate with expression of oncogenic B-cell receptor signaling genes such as BLK and CD79A. Additionally, changes in cell buoyant mass within primary patient specimens ex vivo correlate with sensitivity to Bruton's Tyrosine Kinase inhibitors in vivo in MCL and chronic lymphocytic leukemia, another B-cell malignancy. These findings highlight the value of biophysical properties as biomarkers of response in pursuit of future precision therapeutic strategies.


Conflict of interest statement

M.A.M received research funding from Roche/Genentech and Kite/Gilead, and is an advisory board member of CancerModels.org. S.R.M. is a founder of Travera and Affinity Biosensors. D.M.W. owns equity in Travera, Merck and Co., Bantam, and Ajax, received consulting fees from Astra Zeneca, Secura, Novartis, and Roche/Genentech, and received research support from Daiichi Sankyo, Astra Zeneca, Verastem, Abbvie, Novartis, Abcura, and Surface Oncology. C.E.R. has received honoraria from Research to Practice, Curio Science, and AstraZeneca, and has received institutional research funding from Genentech. A.I.K. has received honoraria from MJH Life Sciences and institutional research funding from AstraZeneca. M.J.A. is a co-founder of, owns equity in, and receives consulting fees from SeQure Dx and receives consulting fees from Chroma Medicine, unrelated to this work. T.P.M., M.A.M., S.R.M., and D.M.W. have filed a patent related to this work. All other authors declare they have no competing interests.

Figures

Figure 1.
Figure 1.. Comparative analysis of biophysical properties, morphological attributes, and transcriptomic features in primary human MCL cells
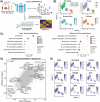
(A) Schematic workflow for isolating tumor cells from MCL PDX models for biophysical profiling, immunophenotyping, histopathologic imaging and bulk RNA/DNA sequencing. Created with BioRender. (B) Histogram distributions of single-cell buoyant mass and stiffness measurements using the SMR, along with representative H&E stain and p53 immunohistochemistry (IHC) images (40X, scale bar: 15 μm) of human-enriched cells from the spleen of three PDX models: DFBL-96069, DFBL-39435, DFBL-91438. Mass and stiffness profiles are from one representative replicate of 3 repeats. A box plot representing the median and interquartile range (IQR), is shown above each histogram, with the median mass and stiffness of DFBL-96069 indicated by a dotted red line for reference. The technical IQR of mass was determined by repeatedly measuring the same 10 μm polystyrene bead using the SMR and that of stiffness by repeatedly measuring the same mouse lymphocytic leukemia cell line L1210 (Fig. S3A–E). The TP53 mutational status based on targeted sequencing (Table S1) and the relative percentage of p53 and Ki67 positive cells based on IHC stains (Fig. S2B) are described below the H&E and IHC images. (C) Gene set signature enrichment evaluation of bulk RNA sequencing of MCL cells isolated from the spleen of the three PDXs.
Figure 2.
Figure 2.. Cell mass and stiffness are strongly associated with the expression of genes annotated for cell division, cell cycle, and B-cell activation.
(A) Schematic workflow linking the biophysical measurements of individual MCL cells from different tissues of three PDX models to downstream scRNA-Seq. Created with BioRender. (B) UMAP analysis of linked single-cell mass, stiffness and scRNA-Seq data of human tumor cells enriched from DFBL-96069, DFBL-39435, DFBL-91438 isolated from different tissues (SP, spleen; PB, peripheral blood; BM, bone marrow; and LIV, liver). Biological replicates, each from a different mouse, were included per tissue, as detailed in Fig. S4. (C) GSEA of the top genes correlated with mass (left) and stiffness (right) measurements among the combined PDX cells. The color represents the p-values, and the size of the spots represents the gene ratio, which is defined as the number of genes in the overlap divided by the total size of the gene set. (D) Biophysical correlation with gene expression in MCL PDXs. Representative genes are color-coded as follows: red for genes positively correlated with both mass and stiffness, purple for genes positively correlated with mass only, green for genes positively correlated with stiffness only, dark blue for genes negatively correlated with mass and stiffness, light blue for genes negatively correlated with stiffness only, and yellow for genes negatively correlated with mass only. (E) UMAP plots showing the expression of nine representative genes positively correlated with MCL cell mass and stiffness, marked as red in Fig. 2D.
Figure 3.
Figure 3.. Mature B-cells undergo significant biophysical change after activation.
(A) Schematic workflow showing the isolation of naïve B cells from PBMCs of three healthy donors, followed by ex vivo stimulation for immunophenotyping and biophysical profiling. Created with BioRender. (B) Summary of the flow gating strategy used to characterize the different B cell populations. Naïve B cells and stimulated B cells at various differentiation stages were identified by immunophenotyping and sorted by FACS on days 0, 3, 7, and 14. The full panel is shown in Supplemental Fig.2 (C) Mean proportion of B cells at different differentiation stages following ex vivo stimulation (n=3). (D) Representative histogram distributions of single-cell buoyant mass (left) and stiffness (right) of each mature B cell population measured by the SMR, from one experiment out of three biological replicates using cells from 3 healthy donors. The number of single cells measured in each condition is indicated on the right. Technical IQRs were measured by trapping single cells (naïve B cell or L1210 for naïve activated D3) on the SMR (Fig. S3FG). (E) Changes in cells’ buoyant mass (above) and stiffness (below) across three independent ex vivo simulations using human PBMCs from three different donors. *P < 0.05, **P < 0.01 as compared between indicated groups (Student’s t-test). (F) Correlation plot of cells’ buoyant mass and stiffness at each stage of differentiation. Data are presented as mean ± SD of the three biological replicates depicted in (E).
Figure 4.
Figure 4.. BCR pathway perturbations drive changes in cell mass and stiffness in Jeko-1 cells.
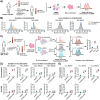
(A) Schematic illustrating BCR inhibition via acalabrutinib treatment (top panel), BCR stimulation through anti-IgM treatment (middle panel) and BCR pathway enhancement through BLK and CD79A overexpression (bottom panel) in Jeko-1 wild type (wt) cells for biophysical profiling. BCR inhibition was confirmed by western blot, and stable overexpression in cell lines was validated using RT-PCR, western blot, and flow cytometry. Functional assays (cell cycle and proliferation) further assessed GFP, BLK or CD79A-expressing cells. Created with BioRender. (B) Median single-cell mass and stiffness measurements obtained using the SMR from >500 Jeko-1 wild type cells after 1h or 24h of ex vivo treatment with DMSO, 0.25 μM, or 0.5 μM acalabrutinib. Data are presented as the median ± SD of three biological replicates. (C) Median single-cell mass and stiffness measurements from >500 Jeko-1 wt cells, with or without IgM stimulation for 10min or 24h, assessed using the SMR. Data represent the median ± SD of three biological replicates. (D) Relative mRNA expression of BLK and CD79A measured by RT-qPCR in Jeko-1 overexpressing GFP, BLK, or CD79A. Results are presented as fold change normalized to GAPDH mRNA. Each bar represents the mean ± SEM of two independent stable cell lines. (E) Representative images of western blot showing BLK, CD79A, GFP and α-actinin protein in Jeko-1 overexpressing GFP, BLK or CD79A. (F) Median single-cell mass and stiffness measurements obtained using the SMR from >500 cells of Jeko-1 wild type (WT) and Jeko1 cells stably overexpressing GFP, BLK or CD79A. Data are presented as median ± SD of three biological replicates. NS: non-significant, *P < 0.05, **P < 0.01 as compared between indicated groups (Student’s t-test).
Figure 5.
Figure 5.. Single-cell mass as a biomarker of susceptibility to pharmacologic inhibition of BCR signaling pathway activity in primary patient specimens.
(A) Workflow to assess the impact of BTK inhibition on the buoyant mass of MCL cells from patients before and after 4 weeks of acalabrutinib treatment. MCL cells were enriched from PBMC by immunomagnetic depletion. Created with BioRender. (B) Single-cell mass distribution of over 1,000 cells measured by the SMR of two acalabrutinib-sensitive MCL primary samples (left) and two less-sensitive MCL primary samples (right) before and after 4 weeks of treatment with the BTKi acalabrutinib as outlined in workflow (A). The samples were categorized as sensitive or less sensitive based on changes in their white blood cell count following BTKi treatment (Fig. S9). (C) Schematic workflow to examine the impact of BTK inhibition on the buoyant mass of MCL or CLL cells pre- and post-acalabrutinib in vivo treatment, followed by 24h of ex vivo drug treatment with DMSO or acalabrutinib. Created with BioRender. One sample of DMSO-treated cells serves as the “reference” distribution. Mass response signals are calculated using EMD analysis, comparing the reference to a second replicate of DMSO-treated cells (“Ref vs DMSO”), and to acalabrutinib-treated cells (“Ref vs Acalabrutinib”) respectively. A p-value is determined by comparing the difference between these two mass response signals against a decision threshold. (D) Mass response signals of two acalabrutinib-sensitive and two less-sensitive MCL primary samples obtained (bottom), which were subjected to 24h of ex vivo drug treatment in duplicate with DMSO or acalabrutinib, as outlined in workflow (C). (E) Mass response signals of three CLL primary samples at pre-treatment (top) and progression (bottom) timepoints, followed by 24h of ex vivo drug treatment in duplicate with DMSO or acalabrutinib as detailed in workflow (C). NS: non-significant, *P < 0.05, **P < 0.01.

References

    1. Guck J., Schinkinger S., Lincoln B., Wottawah F., Ebert S., Romeyke M., Lenz D., Erickson H. M., Ananthakrishnan R., Mitchell D., Käs J., Ulvick S., Bilby C., Optical Deformability as an Inherent Cell Marker for Testing Malignant Transformation and Metastatic Competence. Biophys. J. 88, 3689–3698 (2005). - PMC - PubMed
    1. Godin M., Delgado F. F., Son S., Grover W. H., Bryan A. K., Tzur A., Jorgensen P., Payer K., Grossman A. D., Kirschner M. W., Manalis S. R., Using buoyant mass to measure the growth of single cells. Nat. Methods 7, 387–390 (2010). - PMC - PubMed
    1. Fletcher D. A., Mullins R. D., Cell mechanics and the cytoskeleton. Nature 463, 485–492 (2010). - PMC - PubMed
    1. Son S., Tzur A., Weng Y., Jorgensen P., Kim J., Kirschner M. W., Manalis S. R., Direct observation of mammalian cell growth and size regulation. Nat. Methods 9, 910–912 (2012). - PMC - PubMed
    1. Otto O., Rosendahl P., Mietke A., Golfier S., Herold C., Klaue D., Girardo S., Pagliara S., Ekpenyong A., Jacobi A., Wobus M., Töpfner N., Keyser U. F., Mansfeld J., Fischer-Friedrich E., Guck J., Real-time deformability cytometry: on-the-fly cell mechanical phenotyping. Nat. Methods 12, 199–202, 4 p following 202 (2015). - PubMed

Publication types

LinkOut - more resources