[Preprint]. 2025 May 21:2025.05.20.652233.
doi: 10.1101/2025.05.20.652233.

Adaptive Evolution of Gene Regulatory Networks in Mammalian Neocortical Neurons

Affiliations

Adaptive Evolution of Gene Regulatory Networks in Mammalian Neocortical Neurons

Zhuo Li et al. bioRxiv. .

Abstract

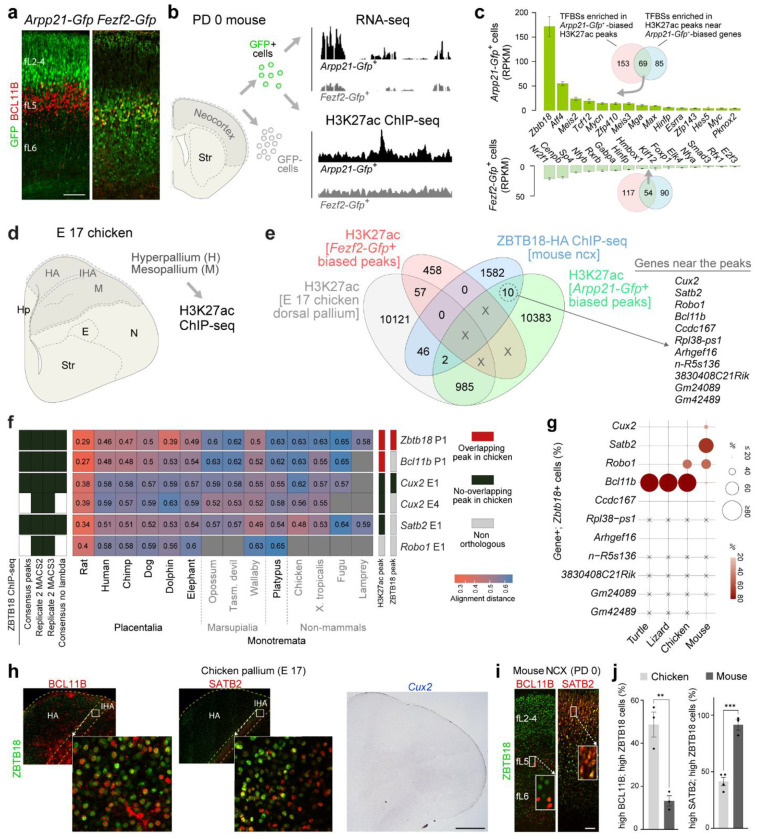
Mammals have evolved a plethora of adaptations that have enabled them to thrive in diverse environments. Among the most significant is the emergence of a more complex brain, exemplified by the dramatic transformation of the dorsal cortex from a single layer of excitatory projection neurons (ExNs) in ancestors to a multilayered cerebral neocortex enriched with diverse intratelencephalic (IT) and extratelencephalic (ET) ExN subtypes. These ExNs established specialized projection systems, such as the corticospinal tract and corpus callosum, enhancing brain connectivity and functionality. However, the evolutionary mechanisms underlying these mammalian-specific adaptations remain elusive. By comparing the landscape of gene expression and cis-regulatory elements (CREs) in mouse ExN subtypes and by cross-species examination of mammalian and non-mammalian CREs, we identified mammalian-specific CREs and expression patterns. The mammalian-specific CREs include a subset bound by ZBTB18 that are associated with genes defining IT and ET subtypes and connectivity. Both ZBTB18 and these target genes have previously been implicated in intellectual disability and autism. Deletion of Zbtb18 in mouse ExNs dysregulated target gene expression, reduced molecular diversity, diminished corticospinal and callosal projections, and increased intrahemispheric cortico-cortical association projections to the prefrontal cortex, resembling features of non-mammalian dorsal pallium. Interestingly, ZBTB18 binding motifs are highly enriched in callosally projecting IT-biased CREs, where they show higher conservation specifically in mammals. This study uncovers critical components and mammalian-specific evolutionary adaptations within a regulatory node essential for neocortical ExN identity and connectivity, with implications for neurodevelopmental and neuropsychiatric disorders.


Figures

Figure 1.
Figure 1.. Mammalian-specific changes in the ZBTB18-associated CREs and TF expression in neocortical ExNs
a) The expression of GFP (green) driven by Arpp21 and Fezf2 CREs and BCL11B immunolabeling (red) in mouse PD 0 neocortex. fL, fetal (immature) layer. Scale bar: 100μm. b) Schematic depicting the isolation of GFP-labeled cells from Arpp21-Gfp and Fezf2-Gfp neocortex and processing for RNA-Seq and H3K27ac ChIP-Seq. c) TFBS for 69 TFs were enriched among both Arpp21-Gfp-biased H3K27ac peaks (red circle) and H3K27ac peaks near Arpp21-Gfp-biased genes (blue circle) as compared to ET neuron-biased peaks and genes, respectively. TFBS enrichments were tested using Fisher’s exact test. Significant TF motifs had a Benjamini-Hochberg corrected p-value < 0.05 and odds ratio > 1. Among these 69 TFs, Zbtb18 was the most highly expressed in IT neurons. For RNA-Seq, a minimum of 3 independent biological replicates were analyzed for each condition. For ChIP-Seq, 2 biological replicates were analyzed for each condition. d) Schematic showing two dorsal pallial regions (H and, M) microdissected from embryonic day (E) 17 chicken embryo. Hp (hippocampus), H (hyperpallium), HA (apical hyperpallium), IHA (interstitial apical hyperpallium), M (mesopallium), N (nidopallium), E (entopallium), Str (striatum). e) Venn diagram showing the co-occurrence of peaks derived from ZBTB18-HA ChIP-Seq, and H3K27ac peaks preferably found in Arpp21-Gfp+ IT neurons, preferably in Fezf2-Gfp+, and in chicken dorsal pallium. 10 peaks appear in the ZBTB18-HA ChIP-Seq samples that were exclusively present in the Arpp21-Gfp+ IT neurons. To meet the IT or ET preference criteria, peaks should be present in both samples of one group and a maximum of one sample from the other group. X represents the common peaks that were present in both Arpp21-Gfp+ IT neurons and Fezf2-Gfp+ ET neurons and were not included in the analysis. f) Heatmap illustrates the pairwise alignment distances between various species of vertebrates for the six putative CREs that overlap with ZBTB18 ChIP-Seq peaks and are associated with IT-neurons and axon guidance molecules. The ChIP-Seq analysis method employed to identify each peak is indicated in the left grid (see methods). Additionally, columns on the right provide information on whether the corresponding region (H3K27ac peak - left column or ZBTB18 ChIP-seq peak - right column) exhibits orthology and H3K27ac activity in the chicken embryonic dorsal pallium. The grey columns depict the non-orthologous regions between the mouse and the chicken. The red and black column depicts the presence or absence of an overlapping H3K27ac peak in the regions that are orthologous in mice and chicken, respectively. Alignment distance of various species of vertebrates is measured from mice. g) Dot plot showing the percentage of cells among Zbtb18 expressing neurons with the dorsal pallium that co-express the genes carrying ZBTB18 binding motif within their loci in Arpp21-Gfp+ neurons amongst mammalian (mouse) and non-mammalian species (chicken, lizard, and turtle) ,–. h-i) Coronal sections of chicken and mouse brain showing the extent of colocalization of BCL11B and SATB2 with ZBTB18. Scale bar: 1mm (mouse brain), 150 μm (mouse inset), 1mm (chicken brain), 300 μm (chicken inset), 250 μm (chicken brain; Cux2). (j) Bar plots showing the percentage of the co-localization of BCL11B and ZBTB18 over total BCL11B-immunopositive cells and SATB2 and ZBTB18 over total SATB2-immunopositive cells in chicken and mouse. A standard t-test, unpaired, was applied. The graph represents mean ± s.e.m. (standard error mean). ** P = 0.0011, *** P = 0.0004 (n = 3/ species).
Figure 2.
Figure 2.. ZBTB18 directly regulates mammalian-specific neocortical enhancer of Cux2
a) Cux2 E1 drives Gfp expression in the PCD 16.5 neocortex. Scale bar: 1mm. b) Cux2 E1-Gfp expression co-localizes with ZBTB18 (closed arrows) in the neocortex. Several ZBTB18+ cells do not express GFP (open arrowheads). Scale bar: 100 μm. c-d) At PCD 16.5, Cux2 E1 mediated expression of GFP overlaps primarily with SATB2 (closed arrows) but not BCL11B. Double open arrowheads (SATB2) and triple open arrowheads (BCL11B) indicate cells immunolabeled for these markers but not Cux2 E1-Gfp. Ordinary one-way ANOVA with Dunnett’s multiple comparisons, with a single pooled variance was used. An unpaired, two-tailed t-test was used to detect differences between groups (d). The graph represents mean ± s.e.m. (standard error mean). * P= 0.0001. Scale bars: 200μm; Inset, 50 μm. e) Line graphs showing the H3K27ac peaks from Arpp2-Gfp+ IT neurons, Fezf2-Gfp- positive ET neurons and ZBTB18-HA ChIP-Seq peaks associated with mouse Cux2. f) Luciferase activity driven by the Cux2 E1 enhancer is significantly increased by ZBTB18. An unpaired t-test was used to detect differences between control and experimental conditions. The graph represents mean ± s.e.m. * P = 0.000040, 0.00029, 0.000057 (ZBTB18, POU3F2, HDAC2+ SIN3A). g) Luciferase activity driven by the Cux2 E1 enhancer from different species is significantly increased by ZBTB18 only in placental mammals (Eutherians). Ordinary two-way ANOVA with Bonferroni’s multiple comparisons test. The graph represents mean ± s.e.m. **** P < 0.0001, ***= 0.002, *= 0.168 (n = 3). h) Cux2 E1 driven expression of GFP is lost following the conditional deletion of Zbtb18; although Cux2 E1-Gfp co-localizes with electroporated, RFP+ cells in control Zbtb18 fl/+ brain (closed arrows), many cells where Zbtb18 has been deleted (red) fail to express GFP and remain in the proliferative niche (open arrowheads), evidencing a proliferation or migration defect. Scale bar: 50 μm. i) Conditional deletion of Zbtb18 in ExNs resulted in a significant downregulation of Cux2 and the upregulation of Bcl11b at both PCD 14.5 and PD 0. Ordinary two-way ANOVA with Bonferroni’s multiple comparisons test, with single pooled variance, was applied. The graph represents mean ± s.e.m. * P= 0.0327, 0.0178 (WT vs Zbtb18 cKO at E15.5, and PD 0), P = 0.0001 (WT vs Zbtb18 cKO at E15.5, and PD 0). The native distribution of CUX1 or SATB2, respectively, (red, upper layers) and BCL11B (green, deep layers) is disrupted by the conditional deletion of Zbtb18 in Neurod6-Cre; Zbtb18 cKO brains at PD 1. Scale bar: 100 μm. j-k) Quantification of cell-type laminar distribution from b and c, respectively. T-tests were used to compare control and knockout cell counts per bin. mean ± s.e.m at each bin. For the p-value, see Supplementary Table 1. For RNA-Seq and RT-PCR n = 3/ timepoint. For immunofluorescent analyses, we counted neurons from independent sections (n = 3/ condition).
Figure 3.
Figure 3.. ZBTB18 depletion reduces callosal and subcerebral projections, while increasing cortico-cortical association projections
a) Visualization of axonal projections by GFP expression shows, in the Neurod6-Cre; Zbtb18 cKO mouse brain reveals the absence of the CC and CST. Wild-type structures are indicated by full arrows and arrowheads and defective tracts in the Zbtb18 cKO brain are marked by open arrowheads and arrows. CC, corpus callosum; AC, anterior commissure; Hip, hippocampus; CST, corticospinal tract; Str, striatum; IC, internal capsule; CP, cerebral peduncle; BLA, basolateral amygdala, excitatory nucleus within amygdala; nLOT, nucleus of lateral olfactory tract. Scale bar: 1mm, 20 μm (CP panel). b) Whole brain image (left top) and coronal sections of the brain at P7 showing the injection site and extent of the GFP expression after AAvrg-CAG-Gfp injections into the medial PFC at PD 3. AAVrg-CAG-Gfp was injected into the PFC of PD 3 mice of Zbtb18 cKO (lower panel) and controls (upper panel) and brains were harvested at PD 7 for the imaging of afferent inputs. Coronal sections of traced PD 7 brains showing more intensive GFP labeling in AUD (bin 6 to 8) than PERI (bin 2 and 3), retrospinal (bin 15 and 16) cortex, and BLA in Zbtb18 cKO mice than control. No contralateral staining is seen in the cKO mice compared to control mice. Scale bar: 500μm; Inset: 125 μm. PERI, perirhinal cortex; cPERI, contralateral perirhinal; AUD, auditory cortex. c) Left: Barplot showing GFP-positive neurons projecting to PFC in the neocortex of Zbtb18 cKO mice compared to control brains at PD 7, as shown in b. unpaired t-test. The graph represents mean ± s.e.m. * P = 0.03 (n = 3). Right: Line graph data showing the percentage distribution of GFP+ neurons projecting to PFC in each bin of neocortex of Zbtb18 cKO mice compared to wild-type brains at PD 7. The number of labeled neurons in each bin was compared using unpaired t-test. The graph represents mean ± s.e.m. *P = 0.03 (bin3), 0.004031 (bin 6), 0.03 (bin 7), 0.012 (bin 14) (n = 3).
Figure 4.
Figure 4.. ZBTB18 regulates axon guidance genes and the mammalian-specific Robo1 enhancer
a) Left panel: Representative images of in utero electroporation of Neurod1-Cre and CALNL-Gfp plasmids into Zbtb18 fl/fl mice with double immunofluorescence shows Zbtb18 is required for the formation of the CC. Right panel: Representative images of co-electroporation of the Neurod1-Zbtb18 constructs rescued this callosal projection phenotype. Scale bar: 500 μm. b) Top 5 Gene ontology terms for the genes that are downregulated (red) or upregulated (blue) in the Zbtb18 −/− (KO) mouse as compared to Zbtb18 +/− (control) at PCD 14.5 (upper bar plot) and in Neurod6-Cre; Zbtb18 cKO as compared to control at PD 0 (lower bar plot). c) Genes encoding axon guidance molecules and up-and down-regulated in the Zbtb18 KO mouse as compared to Zbtb18 +/− (control). d) Line graphs showing the H3K27ac peaks from Arpp2-Gfp+ IT neurons, Fezf2-Gfp- positive ET neurons and ZBTB18-HA ChIP-Seq peaks associated with mouse Robo1. e) Luciferase reporter activity driven by the Robo1 E1 enhancer is significantly increased by ZBTB18. An unpaired t-test was used to detect differences between control and experimental conditions. The graph represents mean ± s.e.m. ** P = 0.00672 (n = 3). f) In situ hybridization shows the reduction of Robo1 and Robo2 expression in the neocortical plate and the induction of Robo3 expression in the Zbtb18 −/− mouse. Scale bar: 150 μm. g-i) Representative images of the in utero electroporation of a Robo1 expression plasmid (CAG-Robo1) allow Gfp-expressing, co-electroporated upper layer neurons to project GFP-positive axons to and across the CC (arrows in the inset) analyzed at PD 0 (g) and PD21 (h); Upper graph depicts the number of axons crossing at the midline on the contralateral side of the IUE at PD 21 (i) and the lower graph shows the number of cells electroporated on the ipsilateral side (i). An unpaired t-test was used to detect differences between control and experimental conditions. The graph represents mean ± s.e.m. * P = 0.030. Scale bar: 500μm, inset 250μm. For each in utero electroporation experiment, 6 control and 3 Robo1 successfully electroporated animals were analyzed at PD 0; at PD 21, 3 control and 3 Robo1 successfully electroporated animals were analyzed. RNA-Seq was conducted on at least 3 independent biological replicates for each condition. In situ hybridization data shown are representative of data generated from multiple sections of at least 3 animals.
Figure 5.
Figure 5.. Increased conservation of ZBTB18 binding motifs in mammalian IT neuron-biased CREs
a) Conserved ZBTB18 binding motifs are identified in putative CREs associated with genes exhibiting enriched expression in Arpp21-Gfp+ IT neurons. b) Between marsupials and placental mammals, enhancers associated with Arpp21-Gfp+/IT neurons have a significantly higher percentage of conserved ZBTB18 motifs than those associated with Fezf2-Gfp+/ET neurons or background sequences. No differences of ZBTB18 motif conservation in non-mammals or monotremes were detected. Asterisks indicate where Fisher’s exact test revealed a significant enrichment of conservation, with a False Discovery Rate corrected P-value < 0.05. c) Among the TFBS cataloged in the JASPAR database and expressed in either IT neurons or ET neurons, the ZBTB18 motif stands out as one of three motifs with consensus sequences uniquely conserved within enhancers linked to genes enriched in IT neurons across placental mammals and marsupials. Fisher’s exact test was used to test for an enrichment of conservation. Red dots represent motifs with a False Discovery Rate corrected P-value < 0.05.

References

    1. Striedter G. & Northcutt R. Brains Through Time: A Natural History of VertebratesA Natural History of Vertebrates.(2019).
    1. Krubitzer L. & Kaas J. The evolution of the neocortex in mammals: how is phenotypic diversity generated? Curr Opin Neurobiol 15, 444–453 (2005). 10.1016/j.conb.2005.07.003 - DOI - PubMed
    1. Rowe T. B., Macrini T. E. & Luo Z. X. Fossil evidence on origin of the mammalian brain. Science 332, 955–957 (2011). 10.1126/science.1203117 - DOI - PubMed
    1. Belgard T. G. et al. Adult pallium transcriptomes surprise in not reflecting predicted homologies across diverse chicken and mouse pallial sectors. Proc Natl Acad Sci U S A 110, 13150–13155 (2013). 10.1073/pnas.1307444110 - DOI - PMC - PubMed
    1. Molyneaux B. J., Arlotta P., Menezes J. R. & Macklis J. D. Neuronal subtype specification in the cerebral cortex. Nat Rev Neurosci 8, 427–437 (2007). 10.1038/nrn2151 - DOI - PubMed

Publication types

LinkOut - more resources