[Preprint]. 2025 Jul 23:2025.05.23.655669.
doi: 10.1101/2025.05.23.655669.

Barcoded monoclonal embryoids are a potential solution to confounding bottlenecks in mosaic organoid screens

Affiliations

Barcoded monoclonal embryoids are a potential solution to confounding bottlenecks in mosaic organoid screens

Samuel G Regalado et al. bioRxiv. .

Abstract

Genetic screens in organoids hold tremendous promise for accelerating discoveries at the intersection of genomics and developmental biology. Embryoid bodies (EBs) are self-organizing multicellular structures that recapitulate aspects of early mammalian embryogenesis. We set out to perform a CRISPR screen perturbing all transcription factors (TFs) in murine EBs. Specifically, a library of TF-targeting guide RNAs (gRNAs) was used to generate mouse embryonic stem cells (mESCs) bearing single TF knockouts. Aggregates of these mESCs were induced to form mouse EBs, such that each resulting EB was 'mosaic' with respect to the TF perturbations represented among its constituent cells. Upon performing single cell RNA-seq (scRNA-seq) on cells derived from mosaic EBs, we found many TF perturbations exhibiting large and seemingly significant effects on the likelihood that individual cells would adopt certain fates, suggesting roles for these TFs in lineage specification. However, to our surprise, these results were not reproducible across biological replicates. Upon further investigation, we discovered cellular bottlenecks during EB differentiation that dramatically reduce clonal complexity, curtailing statistical power and confounding interpretation of mosaic screens. Towards addressing this challenge, we developed a scalable protocol in which each individual EB is monoclonally derived from a single mESC and genetically barcoded. In a proof-of-concept experiment, we show how these monoclonal EBs enable us to better quantify the consequences of TF perturbations as well as 'inter-individual' heterogeneity across EBs harboring the same genetic perturbation. Looking forward, monoclonal EBs and EB-derived organoids may be powerful tools not only for genetic screens, but also for modeling Mendelian disorders, as their underlying genetic lesions are overwhelmingly constitutional (i.e. present in all somatic cells), yet give rise to phenotypes with incomplete penetrance and variable expressivity.


Conflict of interest statement

Competing Interests J.S. is a scientific advisory board member, consultant and/or co-founder of Adaptive Biotechnologies, Camp4 Therapeutics, Guardant Health, Pacific Biosciences, Phase Genomics, Prime Medicine, Scale Biosciences, Sixth Street Capital and Somite Therapeutics. C.T. is a co-founder of Scale Biosciences. All other authors declare no competing interests.

Figures

Figure 1.
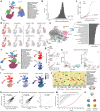
Figure 1.. Characterizing embryoid bodies (EBs) as a model system for studying TF function in early development.
a, 2D UMAP visualization of transcriptomes of 25,937 cells sampled from ~150 pooled mouse EBs, with profiles captured at day 7, 14, and 21. Colors and numbers correspond to 15 cell cluster annotations as listed on the right, based on known marker genes (Supplementary Table 1). The same UMAP is shown three times on the left of the panel, with colors highlighting cells from different days. ExE: extraembryonic. b, Cell cluster composition of mouse EBs from each day. c, UMAP visualization of co-embedded cells from mouse EBs and mouse embryos, at various developmental stages after batch correction of scRNA-seq data. The same UMAP is shown three times, with colors highlighting cells from either mouse EBs (top), embryos during gastrulation (middle), or embryos during early somitogenesis (bottom). d, Twelve cell types from mouse embryos were manually selected based on top marker genes and cell-type correlation analysis, as shown in Supplementary Fig. 1a, that matched cell types identified in mouse EBs. The top 3 TF markers of the 12 cell types were identified using the FindAllMarkers function of Seurat/v3. The expression profiles of these TF markers were examined across various cell types within embryos during gastrulation (top) or mouse EBs (bottom). Each heatmap illustrates the mean gene expression values within each cluster, calculated from original UMI counts normalized to total UMIs per cell, followed by natural-log transformation. Cell type-specific TF expression is shared between gastrulating mouse embryos and mouse EBs. e, Experimental overview. To explore the function of individual TFs in cell fate determination, a monoclonal CRISPRcut or CRISPRi mouse ES line was transduced at low multiplicity of infection with a lentiviral CROP-seq library of gRNAs targeting TFs (3 gRNAs each) and non-targeting controls (NTCs) and containing GFP and puromycin selection markers. After optional puromycin selection to titrate the fraction of perturbed cells, ES cells were self-aggregated into mosaic EBs. After 21 days, GFP-positive cells were subjected to scRNA-seq and gRNA enrichment PCR. Representative microscopy images depicting a pool of GFP-positive EBs made from a puro-selected ES cell population (left) as well as a day 20 EB (right) are shown. The scale bar represents 200 μm. f, Changes in gRNA frequency for different target gene classes. The log2-fold-change in the proportion of gRNA guides was compared between mESCs (amplicon sequencing of gRNA from genomic DNA) and plasmid library, or between EBs (scRNA-seq on 10X Genomics platform) and plasmid library, in both the CRISPRcut pilot experiment (left) and the CRISPRi pilot experiment (right). The targets of the 144 gRNAs were classified into four groups: non-targeting controls (NTC), chromatin modifiers, ES TFs, and developmental TFs. Boxplots represent IQR (25th, 50th, 75th percentile) with whiskers representing 1.5× IQR.
Figure 2.
Figure 2.. Performing large-scale TF screens in mosaic EBs.
a, 2D UMAP visualization of 190,387 cells derived from ~1200 pooled mosaic mouse EBs with CRISPR perturbation targeting 1,644 TFs (‘allTF-mosaic’ experiment). Colors and numbers correspond to 16 cell cluster annotations as listed on the right. b, Changes in gRNA frequency for different target TFs. The log2-fold-change in the proportion of gRNA guides was compared between mouse EBs and plasmid library (‘allTF-mosaic’ experiment). Target genes for gRNAs that drop out completely (left; visualized with small pseudocount) are listed in Supplementary Table 5. c, Quantile-quantile plot summarizing results of the ‘allTF-mosaic’ experiment. TF targets with gRNAs detected in fewer than 50 cells or NTC gRNAs detected in fewer than 20 cells were filtered out. The remaining NTC gRNAs were randomly split into groups, each containing three gRNAs, after which cells within each group were randomly downsampled to 100 cells to approximately match the number of cells for each TF target. Chi-squared tests were conducted to compare cell type compositions between cells detected with each TF target (blue) or NTC gRNA group (red), and all cells detected with NTC gRNAs. The horizontal line represents the cutoff at the 0.05 quantile of the p-values calculated from the NTC gRNA group, and TF targets with p-values below this cutoff were considered significant. d, The same UMAP as in panel a is shown multiple times, with colors highlighting cells with the selected gRNAs detected. Left: Example of two gRNAs for the same target (Trp53) showing reproducible distribution, and two gRNAs for the same target (Esrrg) showing irreproducible distribution. Right: Top three significant TF gRNAs and the top NTC gRNA, ranked by p-values from the chi-squared tests. e, 2D UMAP visualization of 3,335 cells derived from lateral plate mesoderm cells (‘allTF-mosaic’ experiment). The cells are colored and labeled according to their specific TF targets or NTC assignments. Only cells assigned to a single TF target are included in this analysis, and TF targets with fewer than 50 cells are excluded. Of note, the UMAP was generated using LDA as a dimensionality reduction method to visualize perturbation-specific clusters, utilizing the Mixscape library implemented in Seurat/v5 to remove cells that have likely escaped perturbation. Differentially expressed genes (DEGs) were identified between cells in which Lhx8 was targeted vs. NTCs, and the top 20 terms upon GO ontology analysis are presented. f, 2D UMAP visualization of 235,780 cells derived from pooled mosaic mouse EBs with CRISPR perturbation targeting 125 selected TFs (‘125lTF-mosaic’ experiment). Colors and numbers correspond to 19 cell cluster annotations as listed on the right. The same UMAP is shown twice on the right, with colors highlighting cells from each of the two biological replicates within the dataset. g, Quantile-quantile plots summarizing results of each replicate of ‘125TF-mosaic’ experiment, with similar filtering as described for panel c. Chi-squared tests were conducted to compare cell type compositions between cells detected with each TF target (blue) or NTC gRNA group (red), and all cells detected with NTC gRNAs. The horizontal line represents the cutoff at the 0.05 quantile of the p-values calculated from the NTC gRNA group, and TF targets with p-values below this cutoff were considered significant. h, Comparison of results of chi-squared tests for each TF target for different experiments. Left: comparison of ‘allTF-mosaic’ vs. combined replicates of ‘125TF-mosaic’ experiments. Right: comparison of two replicates of ‘125TF-mosaic’ experiment. Selected TF targets with the top 10% of significant p-values from each dataset are labeled. i, The same UMAP as in panel f is shown multiple times, with colors highlighting cells with gRNAs targeting Carm1 detected in replicate 1 (left) or replicate 2 (middle), or Carm1 gene expression (right). Gene expression was visualized as a gene-weighted 2D kernel density plot using the Nebulosa package. j, The three most significant TF targets were selected for each of the three experiments based on the chi-squared tests: Elf2, Rfx2, and Zfp985 (‘allTF-mosaic’ experiment); Carm1, Batf2, and Dlx4 (replicate 1 of ‘125TF-mosaic’ experiment); and Hoxa4, Elk3, and Dmrt2 (replicate 1 of ‘125TF-mosaic’ experiment). Early neurons, floor plate, and eye field in the ‘125TF-mosaic’ dataset were merged into neuroectoderm to align with cell types annotated in the ‘allTF-mosaic’ experiment. For each TF target and each of the 16 cell clusters, the odds ratio was computed based on the frequency of cells within or outside the cell cluster between cells with the TF target and all cells with NTC gRNAs. k, The number of cells identified with each gRNA was compared between the two replicates of the ‘125TF-mosaic’ experiment. l, An independent experiment was performed to compare the gRNA abundances between two mESC replicates (left) or two of the twelve EB replicates (right). m, For each mESC or EB replicate from the independent experiment, the cumulative percentage of reads was plotted across gRNAs, ranked by their abundance from highest to lowest. The x-axis is displayed on a log2 scale, with tick labels showing the original (natural) values. n, EB differentiation led to a significant decrease in clonal complexity. Instead of the expected ~100–1000 founding clones being equally represented in the final ~10,000–30,000 cells (‘mosaic’), we observe stochastic clonal skewing resulting in ~ 2–10 dominant clones (‘jackpotting’).
Figure 3.
Figure 3.. Development of a monoclonal EB screening platform.
a, Schematic of piggyFlex construct and its application to co-express a gRNA as well as an organoid BC that is informative with respect to both gRNA identity and organoid identity. b, Schematic of proof-of-concept experiment for generating and validating monoclonal EBs, each founded by an mESC that is stably tagged with gRNA/organoid BC-expressing piggyFlex construct. In this experiment, all gRNAs were non-targeting controls. To obtain a pool of monoclonal EBs, piggyFlex mESCs were sorted and seeded at low density on mouse embryonic fibroblasts. Individual mESCs grew into colonies for 5 days followed by lifting with Collagenase IV treatment and gentle agitation. Colonies, now clonal aggregates, were then differentiated into EBs on low adherent plates for 8 days. c, 2D UMAP visualization of 19,059 cells derived from 15 manually selected, pooled monoclonal mouse EBs at day 8. Colors and numbers correspond to 16 cell cluster annotations. d, The log2-scaled UMI count and log2-scaled read count are plotted for individual organoid BCs. For the subsequent analyses, 26 organoid BCs with a log2-scaled read count >= 15 were selected. e, For each of these 26 organoid BCs, the log2-scaled UMI count within each cell (left) and the proportion of UMI counts within each cell (right) are plotted. Organoid BCs were assigned to individual cells if the UMI count >= 10 and the proportion >= 30%. f, After excluding cells without any assigned organoid BCs, the UMI count across the 26 organoid BCs for individual cells (n = 16,512) was normalized by the total count per cell, followed by scaling the normalized counts per organoid BC. Pairwise Pearson correlations were then computed for each pair of organoid BCs, are displayed in the top heatmap. The number of cells assigned to each organoid BC is shown in the bottom plot. On the right, dimension reduction using PCA was performed on the UMI counts of organoid BCs across 16,512 cells, followed by visualization in a 2D UMAP. After that, cells assigned multiple organoid BCs were excluded, except for those with correlation coefficients >0.1, which were considered for merging. Organoid BC pairs 1 & 21, 3 & 24, 5 & 22, and 20 & 26 were merged. Cells were then grouped based on their assigned unique organoid BC or merged organoid BCs, resulting in a total of 20 clonotypes comprising 15,870 cells, after excluding clonotypes with fewer than 50 cells (organoid BCs 23 & 25). In the UMAP, cells are colored and labeled by their assigned clonotypes, with unassigned cells colored in gray. g, After filtering out gRNAs expressed in <1% of cells, 22 gRNAs were retained. Cells with fewer than 10 UMIs of gRNAs were excluded, followed by normalizing the gRNA UMI counts to the total count per cell. The proportion of UMI counts per gRNA was calculated for individual cells, and the average proportions were computed for cells within each clonotype. Subsequently, the cumulative proportion of UMIs across gRNAs, ranked by their abundance from highest to lowest, is plotted for each of the 20 clonotypes. Clonotypes with multiple assigned gRNAs are labeled. h, Cell type composition of mouse EBs from each clonotype bin. Colors are defined in panel c. The top plot displays the number of cells sampled for each clonotype. i, The same UMAP as in panel c is shown multiple times, with colors highlighting cells from the three most abundant clonotypes, each dominated by a single assigned gRNA (>90% of total UMIs as shown in panel g).
Figure 4.
Figure 4.. Proof-of-principle TF screen in monoclonal EBs.
a, In the arrayed experiment (left), also referred to as the ‘9TF-monoclonal-arrayed’ experiment, nine TF perturbations and a non-targeting control (NTC) were evaluated using 10 handpicked monoclonal EBs per separate condition, each with unique gRNAs and organoid BCs, pooled and processed to scRNA-seq across 12 lanes of the 10X Genomics platform. In the pooled experiment (right), also referred to as the ‘8TF-monoclonal-pooled’, eight TF perturbations (Carm1 was excluded) and a non-targeting control (NTC) were assessed in a pooled screen of approximately 150 monoclonal EBs, pooled and processed to scRNA-seq across 4 lanes of the 10x Genomics platform. b, 2D UMAP visualization of 102,120 cells derived from pooled monoclonal mouse EBs from the two experiments. Colors and numbers correspond to 12 cell cluster annotations as listed on the right. c, In the arrayed experiment, a total of 202 clonotypes with at least 50 cells were identified. Top left: The cell count for each clonotype is shown. Bottom left: The cumulative proportion of UMIs across gRNAs, ranked by abundance from highest to lowest, is plotted for each of the 202 clonotypes. Middle: Dimensionality reduction using PCA was performed on the UMI counts of organoid BCs across 58,232 cells, followed by visualization in a 2D UMAP. Cells are colored and labeled by their assigned clonotypes, with unassigned cells colored in gray. Right: Proportions of UMIs from the most abundant organoid BC within each clonotype and the UMIs of the corresponding paired gRNA, as determined by the constant organoid BC part, in the directly captured gRNA library. Uniquely assigned clonotypes are shown in red, while doubly assigned ones are in blue. 80.7% of clonotypes exceed 85% on both axes, indicating strong agreement between gRNA/perturbation identities inferred from the organoid BCs vs. direct capture. Uniquely assigned clonotypes are shown in red, while doubly assigned ones are in blue. d, Same as described for panel c, for 157 clonotypes from the pooled experiment. In the middle panel, 22,897 cells are represented. In the right panel, 84.4% of clonotypes exceed 85% on both axes, again indicating strong agreement between gRNA/perturbation identities inferred from the organoid BCs vs. direct capture. e, The same UMAP as in panel b is shown, with colors highlighting cells from clonotypes with gRNAs targeting Carm1 detected in the arrayed experiment. This can be quantified on an ‘per-individual-EB’ level using clonotypes (right, each dot corresponds to an individual clonotype). Cell fractions were compared between clonotypes assigned with Carm1 gRNA vs. NTC gRNA from the arrayed experiment (n = 16 for Carm1 and 19 for NTC) for epiblast (left) and primordial germ cells (right), respectively. Wilcoxon tests were performed, and the resulting p-values are reported. Boxplots represent IQR (25th, 50th, 75th percentile) with whiskers representing 1.5× IQR. f, Hooke was used to compare cell abundances across 12 identified cell types between clonotypes assigned with each TF target vs. NTCs in the arrayed experiment (left) or pooled experiment (right). Clonotypes with fewer than 100 cells were excluded. For each cell type, the resulting natural-log-fold changes in cell abundances between clonotypes assigned to each TF target or NTCs are shown in the heatmap. Each column is scaled, and significant changes (FDR < 0.1) are highlighted by black rectangles. g, The same UMAP as in panel b is shown multiple times, with colors highlighting cells from clonotypes with gRNAs targeting Hand1 detected in the arrayed experiment (left), the pooled experiment (middle), and Hand1 gene expression (right). h, Cell fractions were compared between clonotypes bearing Hand1 gRNAs vs. NTC gRNAs from the arrayed (n = 8 gRNAs for Hand1 and 19 for NTC) and pooled experiments (n = 19 gRNAs for Hand1 and 5 for NTC) for cardiomyocytes and lateral plate mesoderm, respectively. Wilcoxon tests were performed, and the resulting p-values are reported. Boxplots represent IQR (25th, 50th, 75th percentile) with whiskers representing 1.5× IQR. i, The number of significantly up- and down-regulated genes (adjusted p-value < 0.05) differentially expressed between Hand1 knockouts vs. NTC monoclonal EBs were determined using pseudobulk or single cell profiles from two experiments. For pseudobulk analysis, individual clonotypes assigned to Hand1 gRNAs or NTC gRNAs were compared using DESeq2 to identify differentially expressed genes. For single-cell analysis, cells were classified as bearing Hand1 or NTC gRNAs based on UMI abundance exceeding 90%, and differentially expressed genes were identified using the FindMarkers function in Seurat. j, 2D UMAP visualization of 46,754 cells from pooled monoclonal mouse EBs across two experiments, profiled with sci-RNA-seq3. Colors and numbers correspond to 12 cell cluster annotations as listed on the right. k, From the sci-RNA-seq3 data, cell fractions were compared between clonotypes bearing Hand1 gRNAs vs. NTC gRNAs from the arrayed (n = 5 gRNAs for Hand1 and 4 for NTC) and pooled experiments (n = 12 gRNAs for Hand1 and 4 for NTC) for cardiomyocytes and lateral plate mesoderm, respectively. Wilcoxon tests were performed, and the resulting p-values are reported. Boxplots represent IQR (25th, 50th, 75th percentile) with whiskers representing 1.5× IQR.

References

    1. Bissiere S., Gasnier M., Alvarez Y. D. & Plachta N. Cell Fate Decisions During Preimplantation Mammalian Development. Curr. Top. Dev. Biol. 128, 37–58 (2018). - PubMed
    1. Spitz F. & Furlong E. E. M. Transcription factors: from enhancer binding to developmental control. Nat. Rev. Genet. 13, 613–626 (2012). - PubMed
    1. Baillie-Benson P., Moris N. & Martinez Arias A. Pluripotent stem cell models of early mammalian development. Curr. Opin. Cell Biol. 66, 89–96 (2020). - PubMed
    1. Chen B., Du C., Wang M., Guo J. & Liu X. Organoids as preclinical models of human disease: progress and applications. Med. Rev. 4, 129–153 (2024). - PMC - PubMed
    1. Clevers H. Modeling development and disease with organoids. Cell 165, 1586–1597 (2016). - PubMed

Publication types

LinkOut - more resources