[Preprint]. 2025 May 20:2025.05.15.654349.
doi: 10.1101/2025.05.15.654349.

Interlocked transcription factor feedback loops maintain and restore touch sensation

Affiliations

Interlocked transcription factor feedback loops maintain and restore touch sensation

Filipe Marques et al. bioRxiv. .

Abstract

The sense of touch relies on the continuous function of specialized mechanosensory circuits, but the underlying molecular mechanisms remain poorly understood. Here, we report that the conserved transcription factors (TFs) CFI-1 (ARID3) and EGL-5 (HOXA7) jointly maintain in adult C. elegans the molecular identity of two key interneuron types, securing information processing within a mechanosensory circuit. Toggling between normal and low levels of CFI-1 or EGL-5 in adults generated digital-like (ON/OFF) effects both on touch-evoked escape response and interneuron identity. Strikingly, reintroduction of CFI-1 following its prolonged depletion restored escape response defects. Mechanistically, we identified two network motifs, a double-positive CFI-1/EGL-5 feedback loop and positive CFI-1 autoregulation, which together "lock-in" the interneuron identity programs. We propose that these interlocked motifs not only maintain robust escape responses throughout life, but are also essential for the restorability of adult-onset touch defects. Altogether, this work illuminates the molecular principles that maintain adult neuron identity and circuit function, and offers biomedically relevant insights into the restorability of neuronal and behavioral defects caused by mutations or variation in TF-encoding genes.


Conflict of interest statement

DECLARATION OF INTERESTS The authors declare no competing interests.

Figures

Figure 1.
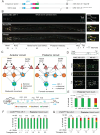
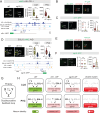
Figure 1.. CFI-1 functions as an on-off switch that regulates posterior touch behavior in adult stage
A. Diagram of the cfi-1 locus. ky651 allele: G-to-A splice acceptor mutation; ot786 allele: a C-to-T mutation generates a premature STOP; kas16 allele: mNG::AID::cfi-1 endogenous reporter; Schematic of CFI-1 protein and its mouse ortholog Arid3a. B-C. Posterior gentle (N = 80) and harsh (N = 120) touch assays on day 1 adult control (N2) and cfi-1 mutant animals. D. Diagram of control (dH2O) and auxin (K-NAA) treatment for CFI-1 depletion. E. Lateral worm view with dashed boxes highlighting the regions where cfi-mNG::AID::CFI-1-expressing neurons were counted. Quantifications after the dH2O (control) and auxin (K-NAA) treatments in kas16[mng::aid::cfi-1]; ieSi57 [peft-3::TIR1::mruby::unc-54 3’utr + cbr-unc-119(+)] animals. N ≥ 27 animals. F. Posterior harsh touch assay on day 2 adult animals with no treatment (-), control (dH2O) and auxin (K-NAA), as well as cfi-1(ot786) mutants for comparison. N = 80 animals. G. Diagram of control (dH2O) and auxin (K-NAA) treatment for CFI-1 depletion followed by “washout”. H-I. Quantification of VNC and tail neurons expressing the endogenous cfi-1 reporter after water (control), auxin (K-NAA) and “washout” recovery treatments on kas16[mNG::AID::cfi-1]; ieSi57 [eft-3p::TIR1::mRuby::unc-54 3’UTR + Cbr-unc-119(+)] animals. N ≥ 5 animals. J. Posterior harsh touch assays with no treatment, and after dH2O (control), auxin (K-NAA) and “washout” recovery treatments. N = 40 animals. Behavioral data in panels B–C, F, and J: Significance was determined using Bonferroni post-hoc tests. Statistical thresholds are indicated as follows: p = 0.0019 (), p = 0.0009 (**), p < 0.0001 ; n.s., not significant. Panels D, G, and J: Green (ON) symbols indicate the presence of CFI-1 expression; red (OFF) symbols indicate its absence. Panel E: Box-and-whisker plots display the number of neurons expressing the fluorescent reporter. Whiskers represent the minimum and maximum values; the horizontal line within each box denotes the median. Each dot represents the average number of neurons in an individual animal. An unpaired, two-sided t-test with Welch’s correction was used: **p < 0.0001. Quantifications in panels H–I: Bonferroni post-hoc tests were used to determine statistical significance: p = 0.0082 (), p = 0.0006 (**), p = 0.00008.
Figure 2.
Figure 2.. A nervous system-wide CFI-1 expression map and a cell-autonomous CFI-1 role in PVC interneurons
A. Diagram of cfi-1 locus. The MN KO allele carries a 769 bp deletion (-11,329 bp to −12,097 bp) in an enhancer element required for MN expression . B. Representative images of the whole worm (day 1 adult) showing mNG::AID::CFI-1 expression (top) NeuroPAL transgene color code (middle), and merge (bottom) strain. See Table S1. Tail insets are magnified to show PVC and LUA interneurons. N = 3 animals. Scale bars: 20 μm. C. Schematic of C. elegans mechanosensory circuit . Circuit assembled using data from nemanode.org. Dataset used: complete adult animal; Connections between neurons have at least 1 chemical synapse or gap junction). For simplicity, not all connections between sensory and/or interneurons are shown. Bottom schematic: cell body position of neurons in the mechanosensory circuits. D. Dashed boxes highlight regions shown in images below. Representative images showing the expression of mNG::AID::CFI-1 in head, VNC and tail of C. elegans animals carrying the mNG::AID::cfi-1 and MN KO allele. Arrowheads: neuronal nuclei. N = 20 animals. Scale bars: 20 μm. E. Posterior harsh touch assays on animals carrying the mNG::AID::cfi-1 and MN KO alleles. N = 100 animals. F. Posterior harsh touch assay in control and LUA-specific cfi-1 RNAi in young adult animals. Five independent lines tested. N = 60. G. Posterior harsh touch assay in C. elegans control vs PVC -specific cfi-1 RNAi in young adult animals. Four independent lines were tested. N = 60 animals. For behavior in panels E-G, *, p = 0.0093; **, p = 0.0009; ***, p < 0.0001; n.s., not significant, as determined by Bonferroni post-hoc tests.
Figure 3.
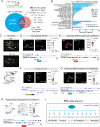
Figure 3.. CFI-1 controls PVC interneuron identity.
A. Top: DNA binding motif of CFI-1 ,. Bottom: Venn diagram of CFI-1-bound genes from ChIP-seq and top 1,000 genes expressed in PVC . B. Protein class ontology analysis (Panther 19.0) of CFI-1 targets in PVC. *: significantly enriched categories (overrepresented relative to entire genome) *, p < 0.01. Fisher’s exact. C. Representative images of NeuroPAL strain in WT and cfi-1(ot786) adult (D1) animals. Inset with inverted colors is shown for better contrast. Dashed circles: LUA and PVC. Large arrowheads = PVC, small arrowheads = LUA. N = 10. D-H. Expression analysis of five PVC fluorescent reporters (flp-20, glr-1, inx-19, nmr-2 and unc-17) in WT and cfi-1(ot786) adult (D1) animals. Top left: Representative images showing reporter expression. Arrowheads: PVC expression. Dashed circle: no PVC expression. Bottom: ChIP-Seq tracks for CFI-1 at its target genes and diagram of reporter used. Top right: Box and whisker plots displaying quantitative fluorescence intensity (F.I) measurements in arbitrary units (A.U.), with the whiskers extending to the minimum and maximum values, and the horizontal line within the box representing the median. Each dot represents an individual neuron. An unpaired t-test (two-sided) with Welch’s correction was performed: *, p < 0.0001 versus WT. Scale bars: 20 μm. I. Summarizing of CFI-1 targets in PVC. *: novel CFI-1 targets.
Figure 4.
Figure 4.. CFI-1 controls LUA interneuron identity.
A. (Top) Directly determined binding motif of CFI-1 ,. (Bottom) Venn diagram summarizing the intersection of CFI-1-bound genes from ChIP-seq and the top 1000 genes expressed in LUA interneurons from CenGEN . B. Graph summarizing protein class ontology analysis (Panther 19.0) of CFI-1 target genes in LUA interneurons. GO categories that are significantly enriched (overrepresented relative to the entire genome) have an asterisk, *, p < 0.01 based on Fisher’s exact test. C-G. Expression analysis of five fluorescent reporters of LUA terminal identity (eat-4, gpa-10, nlp-43, plx-2 and unc-9) in WT and cfi-1(ot786) mutant young adult animals. (Top left) Representative images showing reporters expression. White arrowheads indicate expression in LUA interneurons, while the white dashed circle marks the absence of expression in LUA interneurons (Bottom) IGV snapshots showing CFI-1 binding at loci of genes and a diagram of the reporter allele used. (Top right) box and whisker plots displaying quantitative fluorescence intensity (F.I) measurements in arbitrary units (A.U.), with the whiskers extending to the minimum and maximum values, and the horizontal line within the box representing the median. Each dot represents an individual neuron. An unpaired t-test (two-sided) with Welch’s correction was performed: *, p < 0.0001; n.s., not significant versus WT. Scale bars: 20 μm. H. Diagram summarizing the gene targets of CFI-1 in LUA interneurons. Asterisks denote CFI-1 novel targets.
Figure 5.
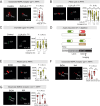
Figure 5.. CFI-1 functions cell-autonomously to establish and maintain PVC and LUA interneuron identity
A. Representative images showing expression of glr-1 reporter in the tail of control vs PVC-specific cfi-1 RNAi in young adult animals. White arrowheads indicate expression in PVC interneurons, while white dashed circle indicates absence of expression in PVC interneuron. N = 20 animals. B-C. Representative images showing expression of plx-2 or gpa-10 reporters in the tail of control vs LUA-specific cfi-1 RNAi in expressing young adult animals. White arrowheads indicate expression in LUA interneurons, while white dashed circles mark absence of expression in LUA interneurons. N = 20 animals. D. Diagrams illustrating the timeline of the ethanol (EtOH) control and auxin (IAA) treatments used for the depletion of CFI-1. Arrow indicates the time when fluorescence imaging was performed. E. Representative images showing expression of the plx-2 reporter in the tail of control (EtOH) vs auxin (IAA) treated young adult animals. White arrowheads indicate expression in LUA interneurons, while white dashed circles mark absence of expression in LUA interneurons. N = 20 animals. F-G. Representative images showing expression of the glr-1 or nmr-1 reporter in the tail of control (EtOH) vs auxin (IAA) treated young adult animals. White arrowheads indicate expression in PVC interneurons, while white dashed circles mark absence of expression in PVC interneurons. N = 20 animals. In panel D, the green (ON) symbol represents presence of EGL-5 expression, while the red (OFF) symbol represents absence of EGL-5 expression. For panels A-C and E-G: Box and whisker plots displaying quantitative fluorescence intensity (F.I) measurements in arbitrary units (A.U.), with the whiskers extending to the minimum and maximum values, and the horizontal line within the box representing the median. Each dot represents an individual neuron. An unpaired t-test (two-sided) with Welch’s correction was performed: *, p = 0.003; **, p < 0.002; ***, p < 0.0001, versus control (no RNAi); (E-G) ***, p < 0.0001 versus control (EtOH or WT). Scale bars: 20 μm.
Figure 6.
Figure 6.. CFI-1 and EGL-5 jointly control PVC and LUA interneuron identity
A. Schematic illustrating the posterior touch circuit in C. elegans, highlighting CFI-1 (cyan outline) and EGL-5 (yellow outline) expression. Their expression only overlaps in LUA and PVC interneurons. B. Diagram of the egl-5 locus. n945 allele: G-to-A mutation in the third exon generates a premature STOP ; u202 allele: a insertion AAAACA in the fourth exon generates a frameshift variant ; syb2361 allele: egl-5 endogenous reporter with an in-frame fluorescent protein mNeonGreen (mNG) insertion followed by a degron sequence immediately before the stop codon of egl-5. C. Expression analysis of an inx-11 fluorescent reporter for LUA terminal identity in WT and egl-5(n945) mutant young adult animals. N = 20 animals. D. Expression analysis of a plx-2 fluorescent reporter of LUA terminal identity in WT, cfi-1(ot786), egl-5(n945) single mutants and cfi-1(ot786); egl-5(n945) double-mutant young adult animals. N = 20 animals. E. Diagram summarizing the gene targets of CFI-1 and EGL-5 in LUA interneurons. Asteriks denote ELG-5 novel targets. Gray arrows: genes not tested. F. Donut chart summarizing the presence of CFI-1 and/or EGL-5 DNA-binding motifs on the CFI-1 bound genes in LUA interneurons. de novo motif discovery analysis of EGL-5 binding peaks identifies an 8 bp-long EGL-5 binding motif. G. flp-20 fluorescent reporter of PVC terminal identity in WT and egl-5(n945) mutant young adult animals. N = 20 animals. H. Expression analysis of a nmr-1 fluorescent reporter of PVC terminal identity in WT, cfi-1(ot786), egl-5(n945) single mutants and cfi-1(ot786); egl-5(n945) double-mutant young adult animals. N = 20 animals. I. Diagram summarizing the gene targets of CFI-1 and EGL-5 in PVC interneurons. Asteriks denote ELG-5 novel targets. Gray arrow: gene that was not tested. J. Donut chart summarizing the presence of CFI-1 and/or EGL-5 DNA-binding motifs on the CFI-1 bound genes in PVC interneurons. For panels C-D and G-H: (Top left) Representative images showing reporters expression. WT image shown is the same in both cfi-1 and egl-5 mutant analyses. White arrowheads indicate expression in LUA or PVC interneurons, while the white dashed circle marks the absence of expression in LUA or PVC interneurons. (Bottom) IGV snapshots showing CFI-1 and EGL-5 binding at loci of genes and a diagram of the reporter allele used. EGL-5 input track is not shown because original authors normalized to the EGL-5 ChIP signal. (Top right) Box and whisker plots displaying quantitative fluorescence intensity (F.I) measurements in arbitrary units (A.U.), with the whiskers extending to the minimum and maximum values, and the horizontal line within the box representing the median. Each dot represents an individual neuron. An unpaired t-test (two-sided) with Welch’s correction was performed: (C, G) *, p < 0.0001 versus WT; (D, H) *, p = 0.0001; **, p < 0.0001; n.s., not significant versus single or double mutant. Scale bars: 20 μm.
Figure 7.
Figure 7.. EGL-5 is required to maintain interneuron terminal identity and normal posterior touch responses
A. Diagram illustrating the timeline of the EtOH (control) and auxin (IAA) treatments used for the depletion of EGL-5. Arrow indicates the time when fluorescence imaging was performed. Representative images showing EGL-5::mNG::AID expression in the tail of C. elegans animals after 3 days of control (EtOH) and auxin (IAA) treatments. N = 10 animals. B. Representative images showing expression of the nmr-1 reporter in the tail of EtOH (control) vs auxin (IAA) treated young adult animals. White arrowheads indicate expression in PVC interneurons. Graph showing fluorescence intensity quantifications of the nmr-1 reporter in PVC interneurons. N = 20 animals. C. Representative images showing expression of the plx-2 reporter in the tail of EtOH (control) vs auxin (IAA) treated young adult animals. White arrowheads indicate expression in LUA interneurons. Graph showing fluorescence intensity quantifications of the plx-2 reporter in LUA interneurons. N = 20 animals. D. Posterior harsh touch assay on C. elegans animals carrying cfi-1 and egl-5 mutations, either alone or in combination, as well as heterozygous animals for each allele. N = 80 animals. E. Diagrams illustrating the timeline of the dH2O (control) and auxin (K-NAA) treatments used for the depletion and recovery of EGL-5. Arrows indicate when touch assays and fluorescence imaging were performed. F. Posterior harsh touch assay on C. elegans animals with no treatment, and after dH2O (control), auxin (K-NAA) and “washout” recovery treatments along with egl-5(n945) mutant animals for comparison. N = 80 animals. G. Diagrams illustrating the timeline of the dH2O (control) and auxin (K-NAA) treatments used for the depletion and recovery of both CFI-1 and EGL-5. Arrows indicate when touch assays and fluorescence imaging were performed. H. Posterior harsh touch assay on C. elegans animals with no treatment, and after dH2O (control), auxin (K-NAA) and “washout” recovery treatments along with cfi-1(ot786); egl-5(n945) double-mutant animals for comparison. N = 100 animals. In panels A, E-F, the green (ON) symbol represents presence of EGL-5 expression, and the red (OFF) symbol represents absence of EGL-5 expression. While in panels G-H, the green (ON) symbol represents presence of both CFI-1 and EGL-5 expression, and the red (OFF) symbol represents absence of both CFI-1 and EGL-5 expression. For panels B-C: Box and whisker plots displaying quantitative fluorescence intensity (F.I) measurements in arbitrary units (A.U.), with the whiskers extending to the minimum and maximum values, and the horizontal line within the box representing the median. Each dot represents an individual neuron. An unpaired t-test (two-sided) with Welch’s correction was performed: (B) *, p = 0.0033, versus control (EtOH); (C) *, p = 0.0006, versus control (EtOH). Scale bars: 20 μm. For behavior in panels D, F and H: *, p = 0.0056; **, p < 0.0001; n.s., not significant, as determined by Bonferroni post-hoc tests.
Figure 8.
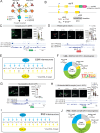
Figure 8.. A double-positive feedback loop ensures robustness of PVC and LUA interneuron identity
A. Expression analysis of a CFI-1 fluorescent reporter in WT and egl-5(n945) mutant young adult animals. N = 20 animals. B. Representative images of the worm tail region showing CFI-1::GFP expression in combination with a LUA reporter (plx-2::mch). White arrowheads indicate expression in LUA interneurons. N = 10 animals. C. Expression analysis of CFI-1::GFP reporter in WT and cfi-1(ot786) mutant young adult animals, N = 20 animals. D. Expression analysis of an EGL-5 fluorescent reporter in WT and cfi-1(ot786) mutant young adult animals. N = 20 animals. E. Representative images of the worm tail region showing EGL-5::GFP expression in combination with a LUA reporter (plx-2::mch). White arrowheads indicate expression in LUA interneurons. N = 10 animals. F. Expression analysis of EGL-5::GFP reporter in WT and egl-5(n945) mutant young adult animals, N = 20 animals G. Theoretical model summarizing the double-positive feedback loop. H. Schematic model summarizing the double-positive feedback loop regulating the identity of LUA and PVC interneurons, and the CFI-1 autoregulation in LUA interneurons. For panels A and D: (Top left) Representative images displaying reporter expression. White arrowheads indicate expression in LUA and/or PVC interneurons, while the white dashed circles mark the absence of expression in LUA interneurons. (Bottom) IGV snapshots showing CFI-1 and EGL-5 binding at cfi-1 or egl-5 gene locus, together with their DB motifs found by TargetOrtho 2 analysis and a diagram of the reporter alleles showed in panels B-C and E-F. Dashed boxes highlight the CFI-1 and/or EGL-5 DB motifs that are in the same region of the ChIP peaks. (Right) Box and whisker plots displaying quantitative fluorescence intensity (F.I) measurements in arbitrary units (A.U.), with the whiskers extending to the minimum and maximum values, and the horizontal line within the box representing the median. Each dot represents an individual LUA or PVC neuron. For panels C and F, (Left graph) Scatter dot plots displaying number of LUA neurons expressing respective fluorescent reporter, with the horizontal line representing the mean with standard error of the mean (SEM). Each dot represents the average number of reporter (+) LUA neurons in one animal. (Right graph) Box and whisker plots displaying quantitative fluorescence intensity (F.I) measurements in arbitrary units (A.U.), with the whiskers extending to the minimum and maximum values, and the horizontal line within the box representing the median. Each dot represents an individual neuron. An unpaired t-test (two-sided) with Welch’s correction was performed: *, p = 0.0011; **, p < 0.0001 versus WT. Scale bars: 20 μm.

Similar articles

References

    1. Brierley S. M. Molecular basis of mechanosensitivity. Auton Neurosci 153, 58–68 (2010). 10.1016/j.autneu.2009.07.017 - DOI - PubMed
    1. Meltzer S., Santiago C., Sharma N. & Ginty D. D. The cellular and molecular basis of somatosensory neuron development. Neuron 109, 3736–3757 (2021). 10.1016/j.neuron.2021.09.004 - DOI - PMC - PubMed
    1. Klingner C. M., Witte O. W. & Gunther A. Sensory syndromes. Front Neurol Neurosci 30, 4–8 (2012). 10.1159/000333373 - DOI - PubMed
    1. Robertson C. E. & Baron-Cohen S. Sensory perception in autism. Nat Rev Neurosci 18, 671–684 (2017). 10.1038/nrn.2017.112 - DOI - PubMed
    1. Lankford C. K., Laird J. G., Inamdar S. M. & Baker S. A. A Comparison of the Primary Sensory Neurons Used in Olfaction and Vision. Front Cell Neurosci 14, 595523 (2020). 10.3389/fncel.2020.595523 - DOI - PMC - PubMed

Publication types

LinkOut - more resources