[Preprint]. 2025 May 21:2025.05.16.654530.
doi: 10.1101/2025.05.16.654530.

Inflamed Microglia like Macrophages in the Central Nervous System of Prodromal Parkinson's Disease

Affiliations

Inflamed Microglia like Macrophages in the Central Nervous System of Prodromal Parkinson's Disease

Le Zhang et al. bioRxiv. .

Abstract

We investigated the role of inflammation in the pathogenesis of prodromal Parkinson's Disease (PD), performing single-cell RNAseq analysis of cerebrospinal fluid (CSF) and blood from 111 individuals, comparing control subjects with early prodromal PD and later PD to patients with multiple sclerosis (MS). Surprisingly, we identified a pleocytosis in the CSF, most pronounced in patients with early PD. Single-cell RNAseq revealed increases in CSF-specific microglia-like macrophages expressing JAK-STAT and TNFα signaling signatures in prodromal PD, with a lack of T cell activation in the CSF. The CSF macrophages exhibited similar transcriptional profiles to dural macrophages from human α-synuclein-expressing PD model mice. These findings uncover a myeloid-mediated TNFα inflammatory process in the CNS of patients with prodromal PD, suggesting a novel pathological mechanism in disease etiology.


Figures

Figure 1:
Figure 1:. Single-cell immune atlas of PBMCs and CSF in prodromal and early stage of PD.
(A) CSF cell counts. (HC: 1.4 ± 0.7; RBD: 3.3 + 2.3, PD: ?? cells/uL; p = 0.045, ANOVA followed by Tukey-Kramer post-hoc test) (B) Schematic overview of the project workflow. (C-F) Uniform Manifold Approximation and Projection (UMAP) plots of single-cell data (C,E) and corresponding cell frequencies (D,F) for blood (C,D) and CSF (E,F). Error bars indicate 95% confidence intervals (D,F).
Figure 2:
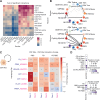
Figure 2:. Global characterization highlighted activation of CSF Macrophages in prodromal PD.
(A,B) Cell population changes for RBD, PD, and PD-RBD were analyzed in Blood (A) and CSF (B) using scCODA (a Bayesian statistical tool) relative to HC, with RBD stratified by PD risk score (right heatmaps). See materials and methods for the details. FDR thresholds: 0.05, ‘**’; 0.1, ‘*’. Color indicates fold change in relative cell frequency. The RBD high-risk group is outlined with dotted lines. (C) CSF macrophages exhibited significant alterations, shown by per-patient frequencies (right). The frequencies in MS and age-matched HC are also shown (left). For PD cohort, the scCODA statistical significance is marked similarly with (A,B). For MS, Statistical testing was performed using the Mann–Whitney U test for each cell population, followed by multiple testing corrections. The adjusted p-value was 1.12 × 10⁻⁴. (D) The absolute cell number of CSF Mac was and T cell populations calculated by the proportion of the cell from scRNAseq and the cell count data. (E) Hallmark gene sets enriched in MS (upper) and RBD (lower) across cell types in comparison to HC (materials and methods). Only positively associated gene sets were visualized. The dashed line at the bottom indicates Padj = 0.05. See Fig. S2 for other comparisons. Only positively associated gene sets were visualized. The dashed line at the bottom indicates Padj = 0.05. (A,B,E lower) Panels include only clusters containing >1000 cells for blood and >500 cells for CSF. (E upper) The same cell types with (F) were retained for the visualization.
Figure 3:
Figure 3:. CSF macrophages activation and linked gene patterns with PD brain microglia.
(A) Myeloid cell populations in CSF on UMAP embeddings. (B) Dot plot depicting signature genes’ mean expression levels and percentage of cells expressing them across clusters. Marker genes for the plot were manually selected. (C) Heatmap showing the transcriptome correlation between myeloid cell populations. (D) Volcano plot showing the differential expressed genes in CSF Macrophage (CSF Mac) between RBD vs HC. For the visualization, genes with mean expression > 0.5 were selected. Genes with FDR < 0.1, Log2 fold change > 0.2 or < −0.2 were highlighted in red. (E) Heatmap showing scaled mean expression of the representative genes. The value was scaled for each gene. (F) Sample-wise HALLMARK gene set activity. *: FDR < 0.05. (G) Mean Fluorescence Intensity (MFI) distribution of IGTA4 in CD16+ Monocytes. (p=0.0147)
Figure 4:
Figure 4:. Cell-cell interaction analysis showed enhanced receiver activity in CSF myeloid cell populations
(A) The heatmap showing the number of interactions inferred by CellphoneDB . The x-axis shows the sender, and the y-axis shows the receiver. (B) The activated ligand-receptor pairs in RBD compared to HC (materials and methods). The upregulated sender signals (upper) and receiver signals (lower) are shown. Interactions with FDR < 0.2 are shown in the black lines. Potentially upregulated interactions (p < 0.05) were shown in the dashed grey lines. (C) Heatmaps show fold change in disease conditions compared to HC for representative CSF Mac ligand-receptor pairs. (D) Dot plot showing the expression of HAVCR2 across CSF myeloid cell populations (upper) and in CSF Mac population across conditions (lower).

References

    1. Kim M. W. et al. Endogenous self-peptides guard immune privilege of the central nervous system. Nature 637, 176–183 (2025). 10.1038/s41586-024-08279-y - DOI - PMC - PubMed
    1. Jo M. G., Kim S. H. & Yun S. P. Hidden face of Parkinson’s disease: is it a new autoimmune disease? Neural Regen Res (2024). 10.4103/NRR.NRR-D-24-01063 - DOI - PMC - PubMed
    1. Kim J. J. et al. Multi-ancestry genome-wide association meta-analysis of Parkinson’s disease. Nat Genet 56, 27–36 (2024). 10.1038/s41588-023-01584-8 - DOI - PMC - PubMed
    1. Nalls M. A. et al. Identification of novel risk loci, causal insights, and heritable risk for Parkinson’s disease: a meta-analysis of genome-wide association studies. Lancet Neurol 18, 1091–1102 (2019). 10.1016/S1474-4422(19)30320-5 - DOI - PMC - PubMed
    1. Qu Y. et al. A systematic review and meta-analysis of inflammatory biomarkers in Parkinson’s disease. NPJ Parkinsons Dis 9, 18 (2023). 10.1038/s41531-023-00449-5 - DOI - PMC - PubMed

Publication types

LinkOut - more resources