[Preprint]. 2025 May 24:2025.05.20.655200.
doi: 10.1101/2025.05.20.655200.

Ketogenic diet prevents obesity-associated pancreatic cancer independent of weight loss and induces pancreatic metabolic reprogramming

Affiliations

Ketogenic diet prevents obesity-associated pancreatic cancer independent of weight loss and induces pancreatic metabolic reprogramming

Ericka Vélez-Bonet et al. bioRxiv. .

Abstract

Pancreatic ductal adenocarcinoma (PDAC) is an aggressive cancer with poor outcomes. Obesity is a risk factor for several cancers including PDAC due to metabolic dysregulation and inflammation. The ketogenic diet (KD) can alter metabolism and has been evaluated for its effects on tumor progression in non-obese but not obese PDAC using genetically engineered mouse models (GEMMs). We hypothesized that ketone bodies and a KD alter cell and tumor metabolism. We show that ketone treatments altered pyrimidine metabolism in PDAC cells. Moreover, in an obese PDAC GEMM, KD prevented tumor progression independent of weight loss but promoted PDAC in a non-obese PDAC GEMM. The KD-specific delay of obesity-associated PDAC was associated with pancreatic metabolic shifts in pyrimidine, cysteine and methionine, and arginine and proline pathways. These findings suggest potential benefits of a KD in preventing obesity-associated PDAC, but highlights some risks in non-obese settings.


Conflict of interest statement

Declaration of interests JSV is cofounder and has equity in Virta Health, is a science advisor for Simply Good Foods, and has authored books on low-carbohydrate diets. The other authors declare no competing interests.

Figures
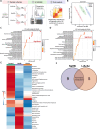
Figure 1:
Figure 1:. Metabolomic profiling of PDAC cells identifies pyrimidine metabolism as a common pathway altered in response to NaHB and LiAcAc treatments.
A) Workflow for untargeted metabolomics of KPC cells treated with ketone bodies. B) PLS-DA plot showing clustering between KPC cells treated with ketone bodies or a vehicle control (n=3). KEGG pathways analysis when KPC cells are treated with C) NaHB or D) LiAcAc. E) Heatmap summarizing the relative abundance of metabolites with p<0.05. F) Venn diagram of the significantly altered pathways in cells treated with ketone bodies.
Figure 2:
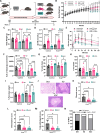
Figure 2:. KD delays tumor development in an obesity-associated PDAC GEMM independent of weight loss using a DIO that is physiologically relevant to humans.
A) Experimental design to evaluate the effects of the KD and KDC following diet-induced obesity (DIO) using 45% high-fat diet (HFD) in an obese PDAC GEMM. B) Body weight of control and KrasG12D mice over 21 weeks (control n=28; KrasG12D n=21). C) Body weight at the study endpoint (week 21) following dietary interventions (n=7–11 mice/group). D) β-OH concentration over the 6-week intervention in control and KrasG12D mice. GTT measuring E) glucose and F) area under the glucose curve (AUC) at endpoint. Percent G) lean mass, H) fat mass, and I) pancreas weight of control and KrasG12D mice at endpoint. J) Representative hematoxylin and eosin (H&E) stains of pancreas sections from KrasG12D mice. Original magnification, ×20. Scale bar, 50 μm (black bar). Pathology scores for K) fibrosis, L) inflammation, and M) total pathological score (n=7 mice/group). N) Percent of KrasG12D mice that developed PDAC or mouse pancreatic intraepithelial neoplasia (mPanIN) lesions. Statistical significance determined by mixed-between-within ANOVA’s where significance between groups indicated by letter pairs listed for control a) DIO b) KD and c) KDC and KrasG12D d) DIO, e) KD and f) KDC (B and E), one-way ANOVA with Brown Forsythe and Dunnet’s corrections (C), one-way ANOVA with Tukey’s correction for multiple comparisons (D), two-way ANOVA with Tukey’s correction for multiple testing (F), Kruskal-Wallis test with Dunn’s correction for multiple testing (G, H, and K-M), or one-way ANOVA with Sídak correction for multiple comparisons (I), *p<0.05, **p<0.01, ***p<0.001, ****p<0.0001
Figure 3:
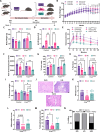
Figure 3:. KD delays tumor development in an obesity-associated PDAC GEMM independent of weight loss using a DIO higher in fat content.
A) Experimental design to evaluate the effects of the KD and KDC following DIO using a 60% HFD in an obese PDAC GEMM. B) Body weight of control and KrasG12D mice over 21 weeks (control n=11; KrasG12D n=16). C) Body weight at the study endpoint (week 21) following dietary interventions (n=3–6 mice/group). D) β-OH concentration over the 6-week intervention in control and KrasG12D mice. GTT measuring E) glucose and F) AUC at endpoint. Percent G) lean mass, H) fat mass, and I) pancreas weight of control and KrasG12D mice at endpoint. J) Representative H&E stains of pancreas sections of KrasG12D mice. Original magnification, ×20. Scale bar, 50 μm (black bar). Pathology scores for K) fibrosis, L) inflammation, and M) total pathological score (n=5–6 mice/group. N) Percent of KrasG12D mice that developed PDAC or mPanIN lesions. Statistical significance determined by mixed-between-within ANOVA’s where significance between groups indicated by letter pairs listed for control a) DIO, b) KD, and c) KDC and KrasG12D d) DIO, e) KD and f) KDC (B and E), two-way ANOVA with Tukey’s correction for multiple testing (C, G, and H), Kruskal-Wallis test with Dunn’s correction for multiple testing (D and K-M), or one-way ANOVA with Sídak correction for multiple comparisons (F and I) *p<0.05, **p<0.01, ***p<0.001, ****p<0.0001
Figure 4:
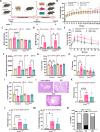
Figure 4:. KD promotes tumor development in a non-obese PDAC GEMM.
A) Experimental design to evaluate the effects of KD, and KDC in a lean PDAC GEMM. B) Body weight of control and KrasG12D mice over 21 weeks (control n=15; KrasG12D n=14). C) Body weight at the study endpoint (week 21) following dietary interventions (n=4–5 mice/group). D) β-OH concentration over the 6-week intervention in control and KrasG12D mice. GTT measuring E) glucose and F) AUC at endpoint. Percent G) lean mass, H) fat mass, and I) pancreas weight of control and KrasG12D mice at endpoint. J) Representative H&E stains of pancreas sections of KrasG12D mice. Original magnification, x20 and x10. Scale bar, 50 μm (black bar) and 100 μm (red bar). Pathology scores for K) fibrosis, L) inflammation, and M) total pathological score (n=4–5 mice/group). N) Percent of KrasG12D mice that developed PDAC or mPanIN lesions. Statistical significance determined by mixed-between-within ANOVA’s where significance between groups indicated by letter pairs listed for control a) non-obese, b) KD and c) KDC and KrasG12D d) non-obese, e) KD and f) KDC (B and E), Kruskal-Wallis test with Dunn’s correction for multiple testing (C, D, F, and K-M), or one-way ANOVA with Sídak correction for multiple comparisons (G, H, and I). *p<0.05, **p<0.01, ***p<0.001, ****p<0.0001.
Figure 5:
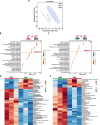
Figure 5:. Metabolic profiling of pancreas tissues in an obese PDAC GEMM following dietary interventions.
A) PLS-DA plot depicting distinct metabolic profiles of each dietary intervention in an obese PDAC GEMM (n=3). KEGG pathway analysis of metabolic pathways in pancreas samples comparing B) KD to DIO mice or C) KDC to DIO mice. D) Heatmap of relative abundance of altered metabolites with p<0.05 between pancreas samples on DIO compared to KD and E) DIO compared to KDC.

References

    1. Siegel R.L., Kratzer T.B., Giaquinto A.N., Sung H., and Jemal A. (2025). Cancer statistics, 2025. CA Cancer J Clin 75, 10–45. 10.3322/caac.21871. - DOI - PMC - PubMed
    1. Srilatha M., Malla R., Adem M.P., Foote J.B., and Nagaraju G.P. (2023). Obesity associated pancreatic ductal adenocarcinoma: Therapeutic challenges. Semin Cancer Biol 97, 12–20. 10.1016/j.semcancer.2023.11.002. - DOI - PubMed
    1. Ruiz C.F., Garcia C., Jacox J.B., Lawres L., and Muzumdar M.D. (2023). Decoding the obesity-cancer connection: lessons from preclinical models of pancreatic adenocarcinoma. Life Sci Alliance 6. 10.26508/lsa.202302228. - DOI - PMC - PubMed
    1. Ruze R., Song J., Yin X., Chen Y., Xu R., Wang C., and Zhao Y. (2023). Mechanisms of obesity- and diabetes mellitus-related pancreatic carcinogenesis: a comprehensive and systematic review. Signal Transduct Target Ther 8, 139. 10.1038/s41392-023-01376-w. - DOI - PMC - PubMed
    1. Lee-Rueckert M., Canyelles M., Tondo M., Rotllan N., Kovanen P.T., Llorente-Cortes V., and Escolà-Gil J.C. (2023). Obesity-induced changes in cancer cells and their microenvironment: Mechanisms and therapeutic perspectives to manage dysregulated lipid metabolism. Semin Cancer Biol 93, 36–51. 10.1016/j.semcancer.2023.05.002. - DOI - PubMed

Publication types

LinkOut - more resources