[Preprint]. 2025 May 21:2025.05.20.654912.
doi: 10.1101/2025.05.20.654912.

Glutamatergic Dysfunction of Astrocytes in Paraventricular Nucleus of Thalamus Contributes to Adult Anxiety Susceptibility in Adolescent Ethanol Exposed Mice

Affiliations

Glutamatergic Dysfunction of Astrocytes in Paraventricular Nucleus of Thalamus Contributes to Adult Anxiety Susceptibility in Adolescent Ethanol Exposed Mice

Aubrey Bennett et al. bioRxiv. .

Abstract

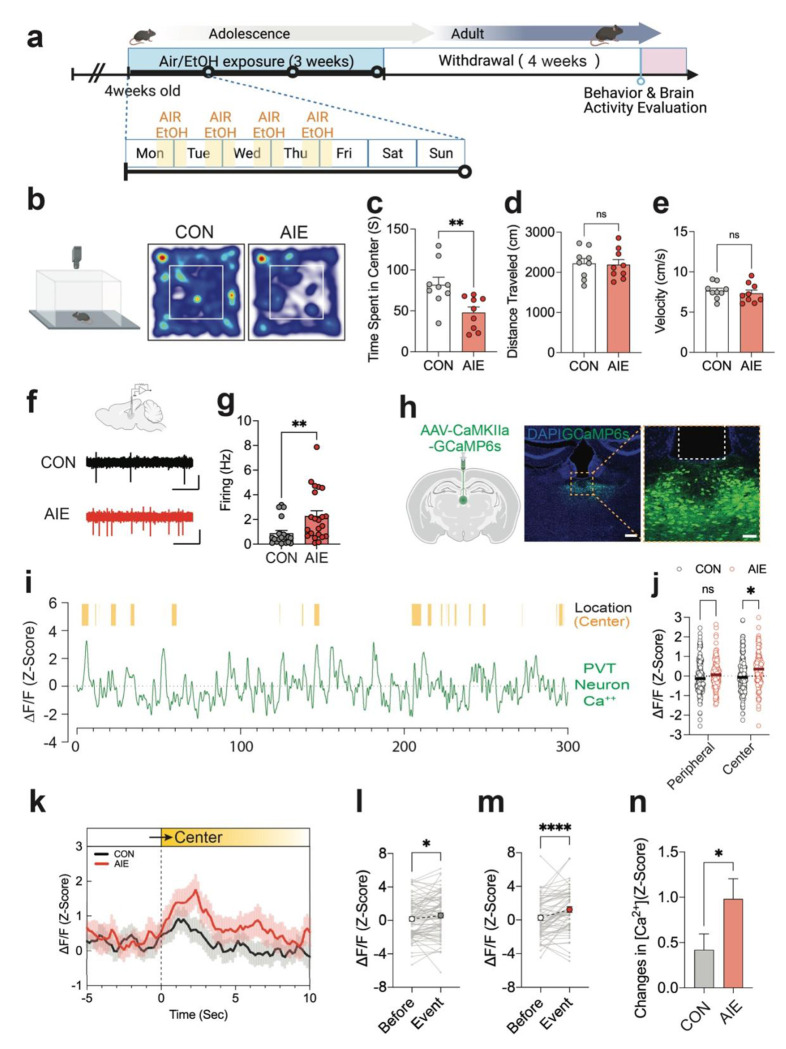
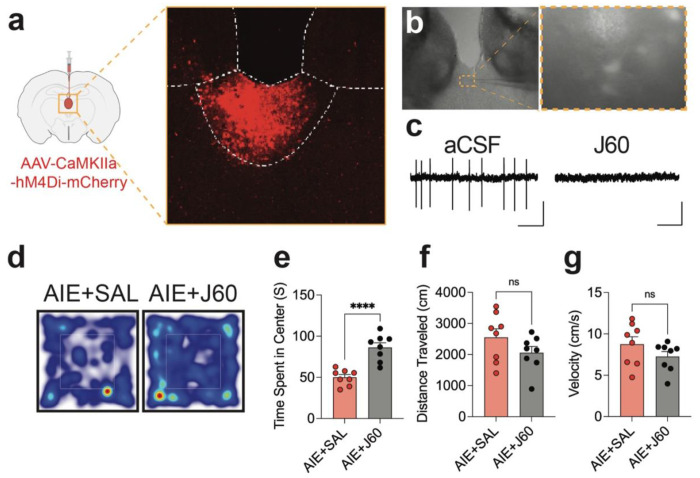
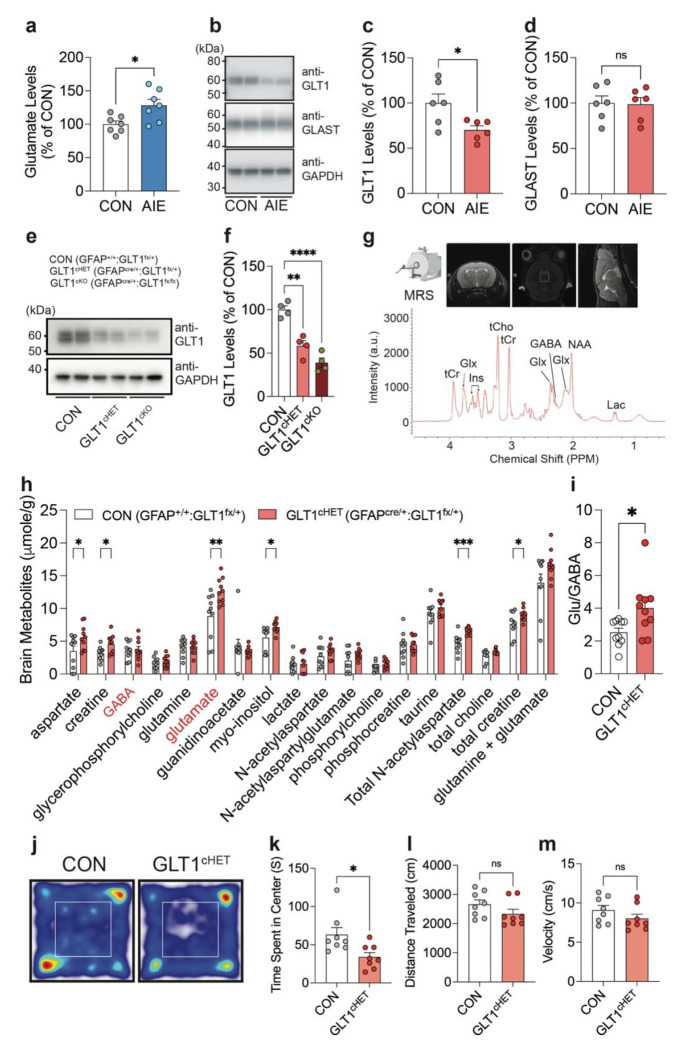
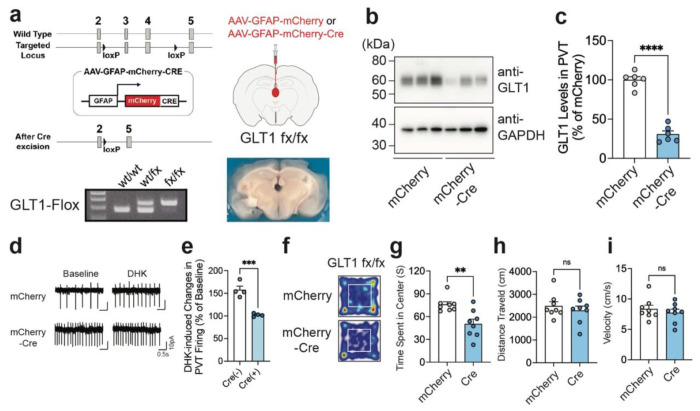
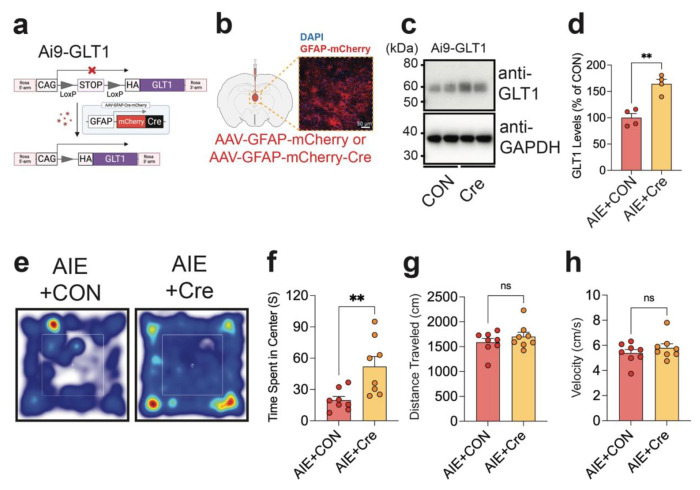
Repeated ethanol exposure during adolescence increases the risk for displaying anxiogenic phenotype in adulthood, but the underlying mechanisms are not fully understood. The paraventricular nucleus of thalamus (PVT) has been considered a hub brain area for controlling the anxiety network in the brain. Recent structural and functional investigations indicate that the PVT exhibits diverse neural signals aligned with early-life events, which are highly linked with anxiety-like behaviors. However, it remains unknown if repeated ethanol exposure during adolescence will affect the coordinated brain activities of the PVT in adulthood, and consequent behavioral adaptation. Here we show that adolescent repeated intermittent ethanol exposure (AIE) triggers anxiety-like behaviors and parallelly induces the glutamatergic adaptation in the PVT after four weeks withdrawal from the last ethanol exposure. The firing rates, along with the spatiotemporal calcium transients in the PVT neurons during behavior were increased in the AIE mice compared to those in the counterpart control mice. Importantly, with the chemogenetic inhibition of the PVT neurons, we found alleviated the anxiety-like behavior in the AIE mice. The increased neuronal activities in the PVT of AIE mice was, at least partly, via the reduction of GLT1 (an astrocyte dominant glutamate transporter, known as EAAT2, slc1a2). Our non-invasive magnetic resonance spectroscopy (MRS) measures also showed an increase in glutamate/GABA ratio in the thalamic area including the PVT of the GLT1 conditional knock-down mice, which exhibited the heightened anxiety-like behavior. In addition, while the selective knock-out of GLT1 in the astrocytes of PVT in the alcohol naïve mice induces anxiogenic phenotypes, the selective upregulation of GLT1 in the PVT astrocytes of the mice that were treated with AIE paradigm alleviated the anxiety-like behaviors as well. These findings highlight the significant role of PVT astrocytic GLT1 in the anxiogenic phenotype in adulthood induced by withdrawal from adolescent repeated ethanol exposure, suggesting that GLT1 in the PVT could serve as a therapeutic target for alcohol use disorder and comorbid emotional disorders.


Conflict of interest statement

Conflict of Interests All the authors declare that the research was conducted without any commercial or financial relationships that could be construed as a potential conflict of interest.

Figures

Fig 1.
Fig 1.. Adolescent repeated ethanol exposure (AIE) induces anxiety-like behaviors in adult mice and increased neuronal activities in the PVT.
Diagram to explain the experimental paradigm (a). Representative traces (b) and pooled data (c-e) showing that adult mice at 4 weeks withdrawal from repeated ethanol exposure during adolescent period (AIE) show heightened anxiety-like behaviors compared to air-exposed counterpart mice (CON) (Fig. 1c, Unpaired t-test, CON vs AIE, t=2.966, df=16, p=0.0091; Fig. 1d, Unpaired t-test, CON vs AIE, t=0.1698 df=16, p=0.8673; Fig. 1e, Unpaired t-test, CON vs AIE, t=0.5992, df=16, p=0.5574, Nmice=9/group). (f-g) Diagram and representative traces (f) and pooled data (g) showing that increased spontaneous firing of PVT neurons after AIE (Fig. 1g, Unpaired t-test, CON vs AIE, t=2.738, df=40, p=0.0092, Ncell=20-22 [5 mice/group]). (h-n) Representative expression of GCaMP6s in the PVT (h), behavior-synced calcium traces (i), and pooled data (j-n) showing that the calcium transients in the PVT neurons are significantly increased in the AIE group (Fig. 1j, Two-way RM ANOVA, Interaction: F(1,643)=1.065, P=0.3026, Group: F(1,643)=5.629, P=0.0180, Location: F(1,643)=9.629, P=0.0020, Center:CON vs Center:AIE, p=0.0195, Nevents=126-197/group [4 mice/group]; Fig. 1l, Paired t-test, Before vs Event, t=2.381, df=73, p=0.0199, Nevents=74/group; Fig. 1m, Paired t-test, Before vs Event, t=4.413, df=61, p<0.0001, Nevents=62/group; Fig. 1n, Unpaired t-test, t=2.008, df=134, p=0.0466, Nevents=62-74/group [4 mice/group]). Data represented as mean ± SEM. *p<0.05, **p<0.01, ****p<0.0001.
Fig 2.
Fig 2.. Chemogenetic inhibition of PVT neurons alleviates anxiety-like behaviors induced by AIE.
(a-b) Representative figures showing the expression of hM4Di-mCherry in the PVT. (c) Representative traces showing the silence of neuronal activity in the hM4Di-positive neurons in the PVT by bath application of DREADDs ligand (J60, 20 μM). (d-g) Represenetative traces (d) and pooled data (e-g) showing that the inhibition of PVT neuronal activities by chemogenetic application rescues the anxiety-like behaviors seen in AIE mice (Fig. 2e, Unpaired t-test, AIE+SAL vs AIE+J60, t=5.511, df=14, p<0.0001, Nmice=8/group; Fig. 2f, Unpaired t-test, AIE+SAL vs AIE+J60, t=1.448, df=14, p=0.1697, Nmice=8/group; Fig. 2g, Unpaired t-test, AIE+SAL vs AIE+J60, t=1.359, df=14, p=0.1955, Nmice=8/group). Data represented as mean ± SEM. ****p<0.0001. J60: JHU37160 (0.3 mg/kg, i.p.).
Fig 3.
Fig 3.. The expression of GLT1, an astrocytic glutamate transporter, is selectively reduced in AIE mice and GLT1 conditional knockdown induces anxiogenic phenotypes.
(a) The quantification of glutamate levels in the dorsal thalamic area including PVT (Unpaired t-test, CON vs AIE, t=2.757, df=12, p=0.0174, Nmice=7/group). (b-d) Representative expression of GLT1 (as known as EAAT2), GLAST (as known as EAAT1), and GAPDH (b) and pooled data (c-d) of western blots showing that the GLT1 expression in the PVT of AIE mice is selectively reduced compared to that of the CON mice (Fig. 3c, Unpaired t-test, CON vs AIE, t=2.725, df=10, p=0.0214, Nmice=6/group; Fig. 3d, Unpaired t-test, CON vs AIE, t=0.1174, df=10, p= 0.9089, Nmice=6/group). (e-f) Representative figures (e) and pooled data (f) confirming the reduction of GLT1 in the conditional GLT1 knockdown mice (GLT1cHET) (One-Way ANOVA, Treatment: F(2,9)=34.20, P<0.0001; Tukey’s posthoc, CON vs. GLT1cHET, p=0.001, CON vs. GLT1cKO, p<0.0001, GLT1cHET vs. GLT1cKO, p=0.0716). (g-i) Non-invasive magnetic resonance spectroscopy (MRS) measurement showing the increase in glutamate levels in the dorsal thalamic area including PVT of GLT1cHET (Fig. 3h, Unpaired t-test, CON vs GLT1cHET, aspartate: t=2.144, df=18, p=0.0460; creatine: t=2.476, df=18, p=0.0235; γ-aminobutyric acid [GABA]: t=0.1341, df=18, p=0.8948; glycerophosphorylcholine: t=0.5625, df=18, p=0.5807; glutamine: t=0.1383, df=18, p=0.8916; glutamate: t=3.006, df=18, p=0.0076; guanidinoacetate: t=0.7702, df=18, p=0.4512; myo-inositol: t=2.624, df=18, p=0.0172; lactate: t=0.08816, df=18, p=0.9308; N-acetylaspartate: t=1.403, df=18, p=0.1777; N-acetylaspartylglutamate: t=1.646, df=18, p=0.1171; Phosphorylcholine: t=1.173, df=18, p=0.2559; Phosphocreatine: t=0.1111, df=18, p=0.9128; Taurine: t=1.351, df=18, p=0.1934; Total N-acetylaspartate: t=4.017, df=18, p=0.0009; total choline: t=2.019, df=18, p=0.0587; total creatine: t=2.253, df=18, p=0.037; glutamine + glutamate: t=1.867, df=18, p=0.0784, Nmice=10/group; Fig. 3i, CON vs GLT1cHET, t=2.497, df=18, p=0.0225, Nmice=10/group). (j-m) Representative traces (j) and pooled data (k-m) showing the anxiogenic profiles of GLT1cHET (Fig. 3k, Unpaired t-test, t=2.700, df=14, p=0.0173; Fig. 3l, Unpaired t-test, t=1.472, df=14, p=0.1632; Fig. 3m, Unpaired t-test, t=1.322, df=14, p=0.2073; Nmice=8/group). Data represented as mean ± SEM. *p<0.05, **p<0.01, ***p<0.001, ****p<0.0001.
Fig 4.
Fig 4.. Region-specific conditional knock-out of GLT1 in the PVT mimics the anxiety-like behaviors induced by adolescent ethanol exposure.
(a) Schematic drawing of Cre-loxP system for GLT1 cKO and genotyping of GLT1 wild-type and floxed mouse. (b,c) The representative figures (b) and pooled data (c) showing the reduction of GLT1 levels in the PVT after the GFAP-promoter driven expression of Cre in the PVT of GLT1 floxed mouse. (d-e) Representative traces (d) and pooled data (e) showing that the DHK-induced changes in neuronal firing were occluded in the PVT of GLT1 cKO (Fig. 4e, Unpaired t-test, Cre[−] vs Cre[+], Unpaired t-test, t=6.166, df=6, p=0.0008). (f-i) The pooled data showing the effects of GLT1 cKO in the PVT astrocytes in the open field test (Fig. 4g, Unpaired t-test, mCherry vs Cre, t=3.471, df=14, p=0.0037; Fig. 4h, Unpaired t-test, mCherry vs Cre, t=0.7261, df=14, p=0.4797; Fig. 4i, Unpaired t-test, mCherry vs Cre, t=0.7156, df=14, p=0.486; Nmice=8/group). Data represented as mean ± SEM. **p<0.01, ****p<0.0001.
Fig 5.
Fig 5.. Rescue of GLT1 expression in the astrocytes of the PVT ameliorates the AIE-induced anxiety-like behavior.
(a) Transgenic approach to overexpress GLT1 in the astrocytes of PVT in a cell-type specific manner. (b-d) Diagram and representative expression (b), representative blots (c), and pooled data (d) showing the increased GLT1 expression in the PVT after the AAV-induced Cre expression in the PVT of the Ai9-GLT1 AIE mice (Fig. 5d, Unpaired t-test, AIE+CON vs AIE+Cre, t=5.398, df=6, p=0.0017, Nmice=4/group). (e-f) Representative traces €, and pooled data (f-h) showing that the astrocytic GLT1 rescue in the PVT ameliorates the AIE-induced anxiety-like behavior in the open field test compared to the counterpart AIE mice (Fig. 5f, Unpaired t-test, AIE+CON vs AIE+Cre, t=3.143, df=14, p=0.0072; Fig. 5g, Unpaired t-test, AIE+CON vs AIE+Cre, t=0.9703, df=14, p=0.3484; Fig. 5h, Unpaired t-test, AIE+CON vs AIE+Cre, t=0.9500, df=14, p=0.3582; Nmice=8/group).

Similar articles

References

    1. Battista JT, Piacentino D, Schwandt ML, Lee MR, Faulkner ML, Farokhnia M, et al. Investigating the relationship between early life adversity, inflammation and alcohol use. Addict Biol. 2023;28(5):e13274. - PMC - PubMed
    1. Sawyer SM, Azzopardi PS, Wickremarathne D, Patton GC. The age of adolescence. Lancet Child Adolesc Health. 2018;2(3):223–28. - PubMed
    1. Schneider M. Adolescence as a vulnerable period to alter rodent behavior. Cell Tissue Res. 2013;354(1):99–106. - PubMed
    1. Radulescu CI, Cerar V, Haslehurst P, Kopanitsa M, Barnes SJ. The aging mouse brain: cognition, connectivity and calcium. Cell Calcium. 2021;94:102358. - PubMed
    1. White A, Hingson R. A Primer on Alcohol and Adolescent Brain Development: Implications for Prevention. In: Sloboda Z, Petras H, Robertson E, Hingson R, editors. Prevention of Substance Use. Cham: Springer International Publishing; 2019. p. 3–18.

Publication types

LinkOut - more resources