[Preprint]. 2025 May 21:2025.05.18.654701.
doi: 10.1101/2025.05.18.654701.

Engineering precision zebrafish alleles of human disease

Affiliations

Engineering precision zebrafish alleles of human disease

Holly R Thomas et al. bioRxiv. .

Abstract

Animal models of human diseases are an essential component of understanding disease pathogenesis and serve as preclinical models for therapeutic evaluation. Recently human patient genome sequencing has defined unique patient variants that result in disease states with different phenotypes than those observed with null alleles. The UAB Center for Precision Animal Modeling (CPAM) serves to analyze patient variant pathogenicity and disease mechanisms through the generation of animal models. We have optimized a zebrafish gene editing platform to successfully generate 11 patient variants (first round: NF1 R1276Q, NF1 G484R, VMA21 G55V, SPOP D144N, SGO1 K23E, Pex10 H310D, and FKRP C318Y; second round: NF1 R681*, NF1 M992del, P53 R175H, and PKD2 L656W) and 1 research allele (p53 K120R). We used CRISPR/Cas9 guide directed cleavage along with single-stranded oligodeoxynucleotide (ssODNs) repair templates to generate these models. We evaluated multiple oligo orientations and sizes, but did not find a unified consensus orientation or size that significantly impacted efficiency, emphasizing the need to empirically evaluate multiple variations for the best homology directed repair (HDR) rate. We determined PCR amplicon Next Generation Sequencing (NGS) evaluation of HDR efficiency at the F0 embryo level is best for determining the ideal guide and oligo combination. Further NGS evaluation of DNA from progeny from F0s (germline derived), not F0 biopsy DNA, is essential to identify germline transmitting founders. Surprisingly we find that most founders exhibit a jackpot effect in the germ line but not in the somatic tissue. We found NGS superior to using ICE (Inference of CRISPR Edits) for determining HDR frequency. When applicable, allelic-specific PCR or allelic specific restriction digestion can be used to genotype mutation carrying F1 generation animals, however we demonstrated that false positives occur. Further, we successfully used high resolution melting curve analysis (HRMA) to differentiate and identify F1 animals with patient variants.

Keywords: CRIPSR/Cas9; Genome Editing; Inference of CRISPR Edits (ICE); Oligo directed homology directed repair (HDR); Precision animal models; Zebrafish; high-resolution melting curve analysis (HRMA).


Conflict of interest statement

DECLARATION OF INTERESTS: “The authors declare no competing interests.”

Figures
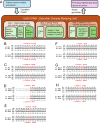
Figure 1:
Figure 1:. CPAM zebrafish patient variant platform and projects.
A) Flow diagram of the CPAM evaluation and zebrafish model production pipeline. B-H) Human wildtype and patient nucleotide sequence and amino acid sequence near the patient variant. This is then aligned with the zebrafish wildtype sequence and potential patient mimetic alteration. Patient change sites are denoted in red font. Exonic sequence is in uppercase, while intronic sequence is in lower case.
Figure 2:
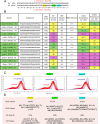
Figure 2:. Guide design and evaluation.
A) As an example of guide selection, three potential PAM sites for nf1a RQ project are depicted. B) Table depicting guides tested, IDT on-target and off-target scores, along with HRMA, NGS and ICE results. Results are color coded to depict strength of result, with green being ideal, yellow being moderate, and magenta being poor. Guide names highlighted in green were used to make the zebrafish line. C) HRMA based evaluation of the guides result in altered HRMA curves (red curves) relative to uninjected (blue curves) indicating guide directed indels generated in the gDNA. D) Evaluation of guide efficiency and identified indels (in order of frequency) by NGS and ICE analysis.
Figure 3:
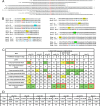
Figure 3:. Single stranded oligo design and HDR evaluation.
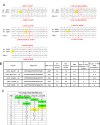
A) Depicts the patient mimetic and mimetic plus additional silent mutations that were used in the oligo design for all the projects. The green font depicts the wildtype sequence, and red font depicts the patient mimetic change. The blue font depicts silent alterations. The yellow, green, or blue highlight denotes the PAM sequence of the guide (G1, G2, or G3) to be used. C) Table summarizing the HDR rates of different oligos using different guides, and with additional alterations. The red border defines combination used to obtain germline transmission of the desired allele; green highlight depicts strong HDR rates, while yellow highlight depicts moderate HDR rates. D) Table comparing HDR rates determined by NGS verse ICE.
Figure 4:
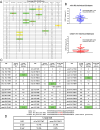
Figure 4:. Germline jackpot allele detection in founders.
A) Table depicting how many F0 founders were analyzed and the NGS derived HDR rate in pooled (n=100) 5dpf F1 embryos. Animals used to identify adult F1 are denoted with red font. Green highlight denotes founders that give >5% HDR; while yellow denotes >2% HDR. B) NGS based HDR frequency evaluation of individual oligo/RNP injected F0 5dpf embryos. C) Table comparing HDR rates from F0 tail biopsy gDNA and pooled 5dpf F1 progeny gDNA; as well as HDR rates of pooled 5dpf F1 progeny gDNA defined by ICE analysis. Green highlights denote the highest HDR rates observed and the F0 from which the desired F1 was obtained. ** denotes false positives determined by ICE analysis (have only one of the 4 desired HDR alterations but were scored as HDR positive by ICE. D) Evaluation to determine if the germline HDR rate is maintained with age or transient germline populations.
Figure 5:
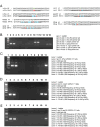
Figure 5:. Using allelic specific PCR to identify germline transmitting founder animals.
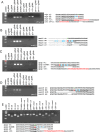
A) Allele specific PCR forward primer (underlined) design for each project. B) Use of each allele specific primer set with wildtype gDNA to determine if mutant specific primer sets amplify a product off of wildtype gDNA. Two wildtype tail biopsies derived gDNA samples are used per primer set. C) Agarose gel of PCR products amplified from nf1a GR F1 heterozygous and wildtype control tail gDNA and pooled 5dpf F1 progeny gDNA from NGS HDR rate defined F0 founders. 359 bp band denotes the presence of the HDR allele. D) Agarose gel of PCR products amplified from vma21 AV F1 heterozygous and wildtype control tail gDNA and pooled 5dpf F1 progeny gDNA from NGS HDR rate defined F0 founders. 303 bp band demotes the presence of the HDR allele. E) Agarose gel of PCR products amplified from pex10 HD F1 heterozygous and wildtype control tail gDNA and pooled 5dpf F1 progeny gDNA from NGS HDR rate defined F0 founders. 234 bp band denotes the presence of the HDR allele.
Figure 6:
Figure 6:. HRMA detection of adult F1 patient carrying mutations.
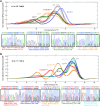
A) Example of HRM analysis of F1 adult tail biopsies from nf1a GR F0#26 (22% HDR rate in pooled F1 embryos). Different curves and associated allelic sequences are denoted by colored curves. Below are Sanger sequencing chromatograms of gDNA from F1 animals with different curves; along with the frequency of the allele in 38 F1 analyzed and the pooled F1 embryos NGS data. B) Example of HRM analysis of F1 adult tail biopsies from fkrp CY F0#16 (2.1% HDR rate in F1 pooled embryos). Different curves and associated allelic sequence is denoted by colored curves. Below are Sanger sequencing chromatograms of gDNA from F1 animals with different curves; along with the frequency of the allele in 94 F1 analyzed and the pooled F1 embryos NGS data.
Figure 7:
Figure 7:. Allelic specific PCR and allelic specific restriction digestion of F1 patient variant carrying animals.
A) Agarose gel of PCR products using nf1a GR allele specific PCR of F1 heterozygous patient variant and heterozygous indels. 359 bp band denotes the presence of the HDR specific allele. B) Agarose gel of PCR products using vma21 AV allele specific PCR of F1 heterozygous patient variant and heterozygous indels. 303 bp band demotes the presence of the HDR specific allele. C) Agarose gel of PCR products using spop DN allele specific PCR of F1 heterozygous patient variant and heterozygous indels. 274 bp band denotes the presence of the HDR specific allele. D) Agarose gel of PCR products using pex10 HD allele specific PCR of F1 heterozygous patient variant and heterozygous indels. 234 bp band demotes the presence of the HDR specific allele. Sequence of wt, HDR allele, and indel are depicted below. Allele specific primer is denoted by underlined sequence in the HDR allele. E) Agarose gel of restriction enzyme digested spop PCR product of F1 heterozygous patient variant and heterozygous indels. 321bp band denotes the uncut product, while 273 and 48 bp bands denote the cut product. Sequence of wt, HDR allele, and indel are depicted below with the XbaI restriction enzyme site underlined in the D144N sequence.
Figure 8:
Figure 8:. Generation of 5 additional zebrafish models:
A) For NF1 R*, NF1 M992del, TP53 R175H, TP53 K120R and PKD2 L656W models, human wildtype nucleotide and amino acid sequence near the patient variants. This is then aligned with the zebrafish wildtype sequence and potential patient mimetic alteration. Patient change sites are denoted in red font. B) summary of guides used, IDT scores, HRM results, and NGS derived HDR frequencies. C) Frequency of positive F0 and the germline transmission frequency for the projects.

References

    1. Chetaille P., Preuss C., Burkhard S., Côté J.M., Houde C., Castilloux J., Piché J., Gosset N., Leclerc S., Wünnemann F., et al. (2014). Mutations in SGOL1 cause a novel cohesinopathy affecting heart and gut rhythm. Nat Genet 46, 1245–1249. 10.1038/ng.3113. - DOI - PubMed
    1. Wang X., Yang Y., Duan Q., Jiang N., Huang Y., Darzynkiewicz Z., and Dai W. (2008). sSgo1, a major splice variant of Sgo1, functions in centriole cohesion where it is regulated by Plk1. Dev Cell 14, 331–341. 10.1016/j.devcel.2007.12.007. - DOI - PMC - PubMed
    1. Karuppasamy M., English K.G., Henry C.A., Manzini M.C., Parant J.M., Wright M.A., Ruparelia A.A., Currie P.D., Gupta V.A., Dowling J.J., et al. (2024). Standardization of zebrafish drug testing parameters for muscle diseases. Dis Model Mech 17. 10.1242/dmm.050339. - DOI - PMC - PubMed
    1. Patton E.E., Zon L.I., and Langenau D.M. (2021). Zebrafish disease models in drug discovery: from preclinical modelling to clinical trials. Nat Rev Drug Discov 20, 611–628. 10.1038/s41573-021-00210-8. - DOI - PMC - PubMed
    1. MacRae C.A., and Peterson R.T. (2023). Zebrafish as a Mainstream Model for In Vivo Systems Pharmacology and Toxicology. Annu Rev Pharmacol Toxicol 63, 43–64. 10.1146/annurev-pharmtox-051421-105617. - DOI - PubMed

Publication types