This is a preprint.
Isoform-Specific Gene Regulation by Progesterone Receptors Drives Divergent Phenotypes in Breast Cancer Cells
- PMID: 40475467
- PMCID: PMC12139888
- DOI: 10.1101/2025.05.19.654935
Isoform-Specific Gene Regulation by Progesterone Receptors Drives Divergent Phenotypes in Breast Cancer Cells
Abstract
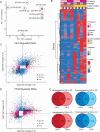
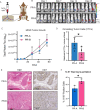
Exposure to progesterone is a recognized risk factor for breast cancer, and PGR polymorphisms are associated with various malignancies. Two progesterone receptor (PR) isoforms, full length PR-B and truncated PR-A, are expressed from the PGR gene in breast tissue and play crucial roles in normal physiology and breast cancer progression. An imbalance in the expression ratio of these isoforms, favoring increased levels of PR-A, is common in breast cancer and is associated with resistance to tamoxifen in luminal A-type tumors. Notably, PRs have recently been implicated in promoting endocrine resistance and driving the expansion of cancer stem-like cell (CSC) populations. Despite this insight, the isoform-specific molecular and epigenetic mechanisms underlying PR action in estrogen receptor positive (ER+) breast cancers remain understudied. Phenotypic studies of T47D cell lines that express exclusively PR-A or PR-B showed that PR isoforms regulate divergent cell fates. PR-B-expressing cells have a higher proliferation rate, while PR-A-expressing cells produce more mammospheres. We profiled progesterone-driven gene expression in cells grown in both adherent (2D) and mammosphere (3D) growth conditions and found differential gene regulation by PR-A and PR-B that is consistent with the observed divergent phenotypes. Only the PR-A-driven gene signature of ER+ breast cancer cells maintained as non-adherent mammospheres robustly predicted poor clinical outcome in the METABRIC data set. We then performed CUT&RUN to identify the genomic binding patterns unique to each PR isoform and their suite of target genes. Our findings indicate that PR-A acts as a regulator of the cell cycle, while PR-B plays a pivotal role in metabolism and intracellular signaling. Our genomic profiling of PRs in this model system has unveiled novel isoform-specific functions of PR. This work has shifted our prior understanding of the role of PRs in gene regulation, offering potential insights for therapeutic interventions in ER+ breast cancer.
Conflict of interest statement
COMPETING INTEREST STATEMENT The authors have no competing interests.
Figures


Similar articles
-
Intercellular communication between extracellular vesicles from conditioned macrophages and breast cancer cells drives endocrine therapy resistance.Front Cell Dev Biol. 2025 Jun 3;13:1548724. doi: 10.3389/fcell.2025.1548724. eCollection 2025. Front Cell Dev Biol. 2025. PMID: 40567500 Free PMC article.
-
Molecular feature-based classification of retroperitoneal liposarcoma: a prospective cohort study.Elife. 2025 May 23;14:RP100887. doi: 10.7554/eLife.100887. Elife. 2025. PMID: 40407808 Free PMC article.
-
Glucose-dependent effect of insulin receptor isoforms on tamoxifen antitumor activity in estrogen receptor-positive breast cancer cells.Front Endocrinol (Lausanne). 2023 Jun 9;14:1081831. doi: 10.3389/fendo.2023.1081831. eCollection 2023. Front Endocrinol (Lausanne). 2023. PMID: 37361518 Free PMC article.
-
Assessing the comparative effects of interventions in COPD: a tutorial on network meta-analysis for clinicians.Respir Res. 2024 Dec 21;25(1):438. doi: 10.1186/s12931-024-03056-x. Respir Res. 2024. PMID: 39709425 Free PMC article. Review.
-
Vitamin D: Production, Metabolism, and Mechanism of Action.2025 Jun 15. In: Feingold KR, Ahmed SF, Anawalt B, Blackman MR, Boyce A, Chrousos G, Corpas E, de Herder WW, Dhatariya K, Dungan K, Hofland J, Kalra S, Kaltsas G, Kapoor N, Koch C, Kopp P, Korbonits M, Kovacs CS, Kuohung W, Laferrère B, Levy M, McGee EA, McLachlan R, Muzumdar R, Purnell J, Rey R, Sahay R, Shah AS, Singer F, Sperling MA, Stratakis CA, Trence DL, Wilson DP, editors. Endotext [Internet]. South Dartmouth (MA): MDText.com, Inc.; 2000–. 2025 Jun 15. In: Feingold KR, Ahmed SF, Anawalt B, Blackman MR, Boyce A, Chrousos G, Corpas E, de Herder WW, Dhatariya K, Dungan K, Hofland J, Kalra S, Kaltsas G, Kapoor N, Koch C, Kopp P, Korbonits M, Kovacs CS, Kuohung W, Laferrère B, Levy M, McGee EA, McLachlan R, Muzumdar R, Purnell J, Rey R, Sahay R, Shah AS, Singer F, Sperling MA, Stratakis CA, Trence DL, Wilson DP, editors. Endotext [Internet]. South Dartmouth (MA): MDText.com, Inc.; 2000–. PMID: 25905172 Free Books & Documents. Review.
References
-
- Arpino G., De Angelis C., Giuliano M., Giordano A., Falato C., De Laurentiis M. and De Placido S. (2009) Molecular mechanism and clinical implications of endocrine therapy resistance in breast cancer. Oncology, 77 Suppl 1, 23–37. - PubMed
-
- Liang J., Yao X., Aouad P., Wang B.E., Crocker L., Chaudhuri S., Liang Y., Darmanis S., Giltnane J., Moore H.M. et al. (2025) ERalpha dysfunction caused by ESR1 mutations and therapeutic pressure promotes lineage plasticity in ER(+) breast cancer. Nat Cancer, 6, 357–371. - PubMed
-
- Bardou V.J., Arpino G., Elledge R.M., Osborne C.K. and Clark G.M. (2003) Progesterone receptor status significantly improves outcome prediction over estrogen receptor status alone for adjuvant endocrine therapy in two large breast cancer databases. J Clin Oncol, 21, 1973–1979. - PubMed
Publication types
Grants and funding
LinkOut - more resources
Full Text Sources
Research Materials
