[Preprint]. 2025 May 20:2025.04.21.649585.
doi: 10.1101/2025.04.21.649585.

Single-Cell Epigenomics Uncovers Heterochromatin Instability and Transcription Factor Dysfunction during Mouse Brain Aging

Affiliations

Single-Cell Epigenomics Uncovers Heterochromatin Instability and Transcription Factor Dysfunction during Mouse Brain Aging

Maria Luisa Amaral et al. bioRxiv. .

Abstract

The mechanisms regulating transcriptional changes in brain aging remain poorly understood. Here, we use single-cell epigenomics to profile chromatin accessibility and gene expression across eight brain regions in the mouse brain at 2, 9, and 18 months of age. In addition to a significant decline in progenitor cell populations involved in neurogenesis and myelination, we observed widespread and concordant changes of transcription and chromatin accessibility during aging in glial and neuronal cell types. These alterations are accompanied by dysregulation of master transcription factors and a shift toward stress-responsive programs driven by AP-1, indicating a progressive loss of cell identity with aging. We also identify region- and cell-type-specific heterochromatin decay, characterized by increased accessibility at H3K9me3-marked domains, activation of transposable elements, and upregulation of long non-coding RNAs, particularly in glutamatergic neurons. Together, these results reveal age-related disruption of heterochromatin maintenance and transcriptional programs, identify vulnerable brain regions and cell types, and pinpoint key molecular pathways altered in brain aging.


Conflict of interest statement

B.R. is a co-founder and consultant of Arima Genomics, Inc., and a co-founder of Epigenome Technologies Inc.

Figures
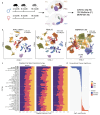
Figure 1.
Figure 1.. Single-nucleus multi-omic atlas of brain aging across eight regions in the mouse.
(A) Schematic of experimental design showing brain regions profiled from male and female mice at 2, 9, and 18 months of age using snATAC-seq, 10X Multiome, and MERFISH. (B) Uniform Manifold Approximation and Projection (UMAP) of single-nucleus ATAC-seq (left), RNA-seq (center), and MERFISH (right) datasets, annotated by cell type. (C) Weighted cell-type proportions across ages for each modality, highlighting three progenitor populations that decline with age. (D) Statistical significance of age-associated changes in cell-type proportions (Wilcoxon rank-sum test).
Figure 2.
Figure 2.. Aging depletes progenitor populations and disrupts neurogenic regulatory programs.
(A) MERFISH spatial maps of brain slices (plates 46 and 69) with cells colored by annotated cell types (Table S1). (B) Representative MERFISH images across three ages showing immature oligodendrocytes (IOL), OB-STR-CTX inhibitory immature neurons (Inh IMN), and dentate gyrus (DG) progenitors. (C) Age-associated changes in progenitor cell-type proportions from MERFISH data. (D) Progenitor cell-type proportions from snATAC-seq across brain regions and sexes. (E) Motif enrichment analysis of age-associated differentially accessible cCREs in progenitor populations. (F) Heatmap showing normalized accessibility (z-score) of age-differential cCREs in OB-STR-CTX Inh IMN, stratified by age and sex. (G) Proportion of downregulated cCREs containing Lhx2 motifs in OB-STR-CTX Inh IMN; bottom shows the Lhx2 consensus motif. (H) MA plot of age-differential gene expression (18 mo vs. 2 mo) in OB-STR-CTX Inh IMN. (I) GO term enrichment for upregulated (top) and downregulated (bottom) genes in OB-STR-CTX Inh IMN. (J) Age-associated expression of Pax6, a direct target of Lhx2, in scRNA-seq (top) and MERFISH (bottom) datasets.
Figure 3.
Figure 3.. Aging oligodendrocytes exhibit transcriptional and chromatin changes associated with myelination loss and Sox factor decline.
(A) Heatmap showing normalized accessibility (z-score) at age-differential cCREs in oligodendrocytes across brain regions and sexes. (B) Motif enrichment of downregulated (left) and upregulated (right) age-differential cCREs in oligodendrocytes; asterisks denote significance (adjusted p < 0.01). (C) Aggregate motif accessibility plots for Klf1 and Sox6 in upregulated, downregulated, and non-changing peaks in oligodendrocytes (Oligo NN). (D) MA plot of age-differential gene expression (18 mo vs. 2 mo) in oligodendrocytes. (E) GO term enrichment analysis for upregulated (top) and downregulated (bottom) genes. (F) Bar plot showing average age log fold-change of gene expression for downregulated, non-significant, and upregulated genes, with corresponding changes in linked peaks from ABC score analysis. (G) Motif logos for the most enriched motifs in peaks linked to upregulated (top) and downregulated (bottom) genes in aging oligodendrocytes. (H) Age-associated expression of the myelination gene Mal from scRNA-seq (left) and MERFISH (right).
Figure 4.
Figure 4.. Aging induces region-specific regulatory reprogramming in dentate gyrus glutamatergic neurons
(A) Heatmap of normalized chromatin accessibility (z-score) at age-differential cCREs in dentate gyrus (DG) neurons across brain regions. (B) Motif enrichment analysis of downregulated (left) and upregulated (right) age-differential cCREs using all peaks as background; asterisks denote significance (adjusted p < 0.01). (C) Aggregate accessibility plots of AP-1 and CTCF motifs at upregulated, downregulated, and all cCREs across DG neuron regions. (D) MA plot of age-differential gene expression between 2-month-old and 18-month-old DG neurons. (E) Gene Ontology (GO) enrichment analysis of genes upregulated with age. (F) Bar plot showing mean age log₂ fold change of downregulated, non-significant, and upregulated genes, along with corresponding changes in linked cCREs from ABC analysis. Right: Motif logos for the most enriched motifs in peaks linked to up- and downregulated genes.
Figure 5.
Figure 5.. Upregulated accessibility and transcriptional shifts within heterochromatin-associated genomic hotspots.
(A) Differentially accessible regions (DARs) in aging neurons. Left: Non-H3K9me3 peaks show a balanced distribution of up- and downregulated peaks. Middle: H3K9me3-overlapping peaks are predominantly upregulated, especially in glutamatergic neurons. Right: Transposable element (TE) subfamilies show widespread age-related increases in accessibility. (B) Motif enrichment analysis of age-upregulated DARs across neuronal populations. (C) Genomic hotspots with higher-than-expected density of DARs across cell types, colored by overlap with H3K9me3 domains. (D) log fold change and significance of lncRNA Gm48530 expression across brain regions, located within an aging hotspot. (E) Chromosomal hotspot on chromosome 13 across brain regions; each point represents a cell type, colored by cell type clade. (F) Age-related transcriptional changes from scRNA-seq. Left: log₂ fold change of genes across cell types, highlighting Gm48530 among the most significantly upregulated. Right: TE subfamily expression shows a broader trend of upregulation. (G) Proportion of the top 100 most upregulated and downregulated genes that are long noncoding RNAs or pseudogenes. (H) Genome browser view of the chromosome 13 hotspot, including Gm48530 and IAPLTR3-int, showing increased accessibility, expression, and hypomethylation with age.

References

    1. Mattson M.P., and Arumugam T.V. (2018). Hallmarks of brain aging: Adaptive and pathological modification by metabolic states. Cell Metab. 27, 1176–1199. - PMC - PubMed
    1. Almanzar N., Antony J., Baghel A.S., Bakerman I., Bansal I., Barres B.A., Beachy P.A., Berdnik D., Bilen B., Brownfield D., et al. (2020). A single-cell transcriptomic atlas characterizes ageing tissues in the mouse. Nature 583, 590–595. - PMC - PubMed
    1. Jin K., Yao Z., van Velthoven C.T.J., Kaplan E.S., Glattfelder K., Barlow S.T., Boyer G., Carey D., Casper T., Chakka A.B., et al. (2025). Brain-wide cell-type-specific transcriptomic signatures of healthy ageing in mice. Nature 638, 182–196. - PMC - PubMed
    1. Klemm S.L., Shipony Z., and Greenleaf W.J. (2019). Chromatin accessibility and the regulatory epigenome. Nat. Rev. Genet. 20, 207–220. - PubMed
    1. López-Otín C., Blasco M.A., Partridge L., Serrano M., and Kroemer G. (2023). Hallmarks of aging: An expanding universe. Cell 186, 243–278. - PubMed

Publication types

LinkOut - more resources