[Preprint]. 2025 May 21:2025.05.16.654550.
doi: 10.1101/2025.05.16.654550.

ChromMovie: A Molecular Dynamics Approach for Simultaneous Modeling of Chromatin Conformation Changes from Multiple Single-Cell Hi-C Maps

Affiliations

ChromMovie: A Molecular Dynamics Approach for Simultaneous Modeling of Chromatin Conformation Changes from Multiple Single-Cell Hi-C Maps

Krzysztof H Banecki et al. bioRxiv. .

Abstract

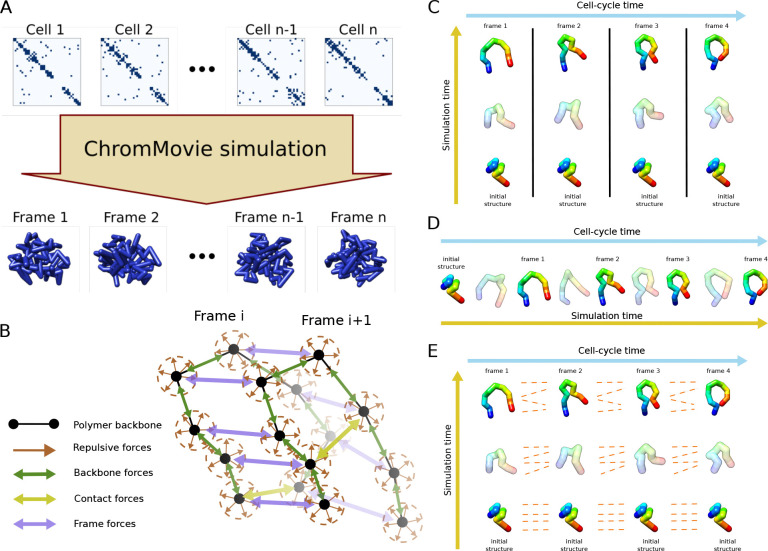
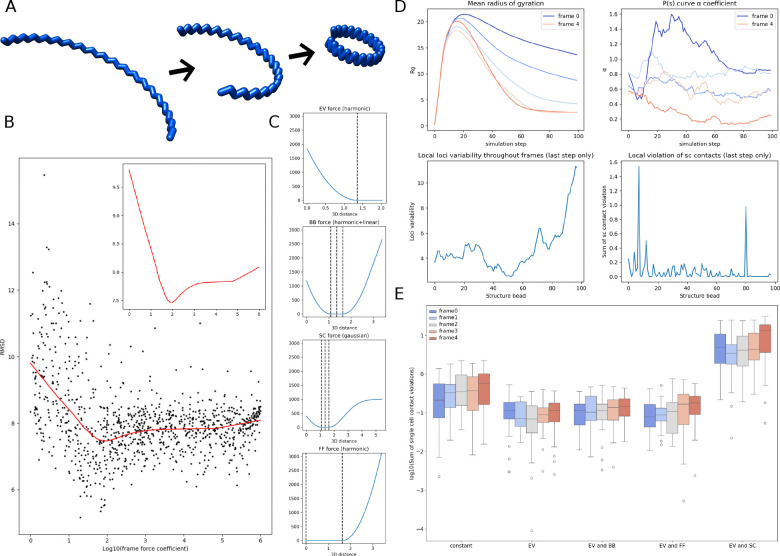
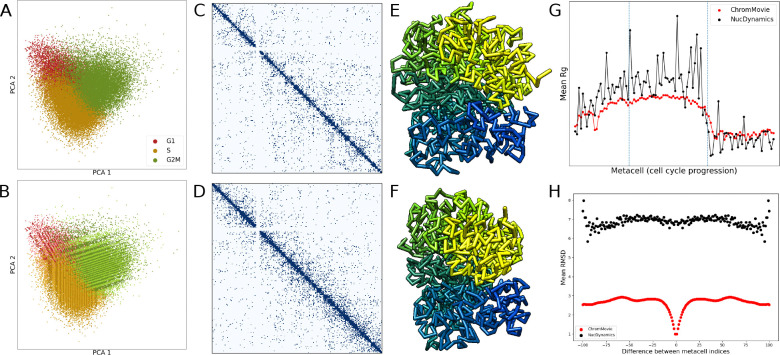
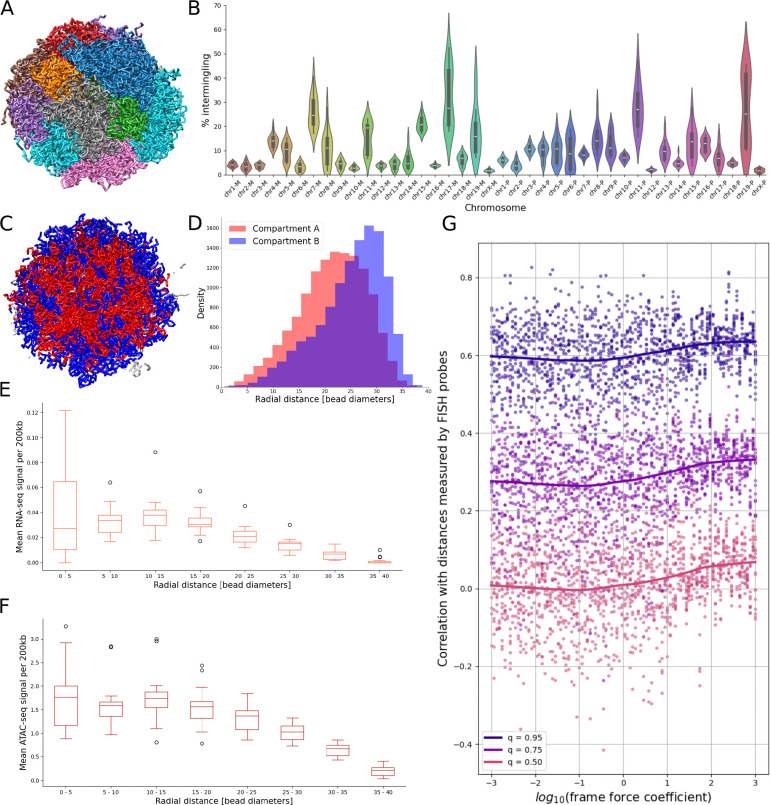
The development of 3C-based techniques for analyzing three-dimensional chromatin structure dynamics has driven significant interest in computational methods for 3D chromatin reconstruction. In particular, models based on Hi-C and its single-cell variants, such as scHi-C, have gained widespread popularity. Current approaches for reconstructing the chromatin structure from scHi-C data typically operate by processing one scHi-C map at a time, generating a corresponding 3D chromatin structure as output. Here, we introduce an alternative approach to the whole genome 3D chromatin structure reconstruction that builds upon existing methods while incorporating the broader context of dynamic cellular processes, such as the cell cycle or cell maturation. Our approach integrates scHi-C contact data with single-cell trajectory information and is based on applying simultaneous modeling of a number of cells ordered along the progression of a given cellular process. The approach is able to successfully recreate known nuclear structures while simultaneously achieving smooth, continuous changes in chromatin structure throughout the cell cycle trajectory. Although both Hi-C-based chromatin reconstruction and cellular trajectory inference are well-developed fields, little effort has been made to bridge the gap between them. To address this, we present ChromMovie, a comprehensive molecular dynamics framework for modeling 3D chromatin structure changes in the context of cellular trajectories. To our knowledge, no existing method effectively leverages both the variability of single-cell Hi-C data and explicit information from estimated cellular trajectories, such as cell cycle progression, to improve chromatin structure reconstruction.

Keywords: Chromatin Structure; Molecular Dynamics; Single-Cell Hi-C; Trajectory Inference.


Conflict of interest statement

Competing interests No competing interest is declared.

Figures

Fig. 1.
Fig. 1.
(A) Overview of the ChromMovie algorithm. The algorithm takes an ordered list of scHi-C maps representing different time points of a cellular process. It then simulates all time points simultaneously, generating an ordered list of 3D structures as the result. (B) The four main types of forces used in the ChromMovie simulation: repulsive forces, backbone forces, contact forces, and frame forces. (C, D, E) Three approaches to modeling multiple ordered scHi-C maps: independent modeling (C), sequential modeling (D), and parallel simultaneous modeling (E). ChromMovie implements a form of simultaneous modeling, which, to our knowledge, is the first of its kind in the field of chromatin modeling.
Fig. 2.
Fig. 2.
ChromMovie in silico analysis. (A) In silico example of a ring-forming contracting zigzag structure used for initial validation. (B) Results of 1,000 runs of the ChromMovie simulation on the in silico model. Root Mean Square Deviation (RMSD) was used to compare with the original structure. The top-right corner shows a zoomed-in view of the fitted Loess curve, indicating a clear minimum. (C) Examples of the force potentials used in ChromMovie. From top to bottom: harmonic excluded volume (EV) potential, harmonic backbone (BB) potential with linear approximation for larger distances, Gaussian single-cell (SC) potential, and harmonic frame-force (FF) potential. (D) Selected diagnostic plots from the ChromMovie reporter. The mean radius of gyration indicates greater compaction for frames closer to the end, consistent with the original structure. P(s) curve allows for analysis of the contact frequency distribution. Local loci variability helps visualize regions of the structure that experience the greatest changes during the studied cellular process. (E) Single-cell contact violations across different ChromMovie runs, comparing cases with the gradual increase of the respective force coefficient turned on or kept constant.
Fig. 3.
Fig. 3.
Validation of ChromMovie using ChAIR data. (A) Visualization of single-cell ChAIR data for the k562 cell line using 2D principal component analysis (PCA) (see [80]). (B) The same single-cell data with metacells highlighted as alternating stripes to indicate grouping. (C) and (D) Representative single-cell contact maps for chromosome 12, illustrating a more relaxed chromatin state during the S phase (C) and a more condensed state in the G2M phase (D). (E) and (F) Corresponding 3D chromatin structures generated by ChromMovie for the contact maps shown in (C) and (D), respectively. (G) The mean radius of gyration across all 102 metacells throughout cell cycle progression, comparing ChromMovie and NucDynamics. (H) Mean RMSD values plotted as a function of frame shifts, assessing structural consistency between consecutive frames in both ChromMovie and NucDynamics models.
Fig. 4.
Fig. 4.
Analysis of ChromMovie-derived structural features using single-cell data. (A) ChromMovie reconstruction of a single-cell, whole-genome diploid mouse nucleus. Individual chromosomes are shown in distinct colors to visualize chromosomal territories. (B) Quantification of inter-chromosomal intermingling based on the structure in (A). Maternal chromosomes are labeled with the suffix “-M” and paternal chromosomes with “-P”. (C) ChromMovie model of the same cell highlighting chromatin compartmentalization. Compartment A (red) and compartment B (blue) are visualized in a central nuclear cross-section. Grey segments represent regions with unknown compartment (mostly centromeres and telomeres). (D) Radial distribution of compartments A and B based on the model in (C), demonstrating preferential localization of active (A) and inactive (B) regions within the nuclear volume. (E) Radial distribution of RNA-seq signal from the ChAIR dataset, showing that transcriptionally active regions are enriched closer to the nuclear center. (F) Radial distribution of ATAC-seq signal from the same dataset, indicating increased chromatin accessibility near the nuclear interior. (G) Validation of ChromMovie structural models using 3D-FISH probe data from Beagrie et al. (2017) [19]. Each point represents a unique combination of cell, frame force coefficient, and the corresponding quantile (0.50, 0.75, or 0.95) of the correlation distribution between modeled and experimental distances. Loess trend lines are shown for each quantile to highlight the effect of frame force regularization.
Fig. 5.
Fig. 5.
Benchmarking of ChromMovie computational time on a single NVIDIA A100 GPU. For each number of cells a multi-resolution simulation was conducted for resolutions 5Mb, 2Mb, 500kb and 200kb.

Similar articles

References

    1. Jerkovic Ivana and Cavalli Giacomo. Understanding 3d genome organization by multidisciplinary methods. Nature Reviews Molecular Cell Biology, 22:511–528, 2021. - PubMed
    1. Cremer T, Cremer C, Schneider T, Baumann H, Hens L, and Kirsch-Volders M. Analysis of chromosome positions in the interphase nucleus of chinese hamster cells by laseruv-microirradiation experiments. Hum Genet., 62:201–209, 1982. - PubMed
    1. Trzaskoma Paweł, Ruszczycki Błażej, Lee Byoungkoo, Pels Katarzyna K., Krawczyk Katarzyna, Bokota Grzegorz, Szczepankiewicz Andrzej A., Aaron Jesse, Walczak Agnieszka, Ma lgorzata A. Śliwińska , Adriana Magałska Michal Kadlof, Wolny Artur, Parteka Zofia, Arabasz Sebastian, Magdalena Kiss-Arabasz Dariusz Plewczynski, Ruan Yijun, and Wilczyński Grzegorz M.. Ultrastructural visualization of 3d chromatin folding using volume electron microscopy and dna in situ hybridization. Nature Communications, 11, 2020. - PMC - PubMed
    1. Shtengel Gleb, Galbraith James A., Galbraith Catherine G., Jennifer Lippincott-Schwartz Jennifer M. Gillette, Manley Suliana, Sougrat Rachid, Waterman Clare M., Kanchanawong Pakorn, Davidson Michael W., Fetter Richard D., and Hess Harald F.. Interferometric fluorescent super-resolution microscopy resolves 3d cellular ultrastructure. Proceedings of the National Academy of Sciences, 106(9):3125–3130, 2009. - PMC - PubMed
    1. Kadlof Michał, Banecki Krzysztof, Chiliński Mateusz, and Plewczynski Dariusz. Chromatin image-driven modelling. Methods, 226:54–60, 2024. - PubMed

Publication types

LinkOut - more resources