[Preprint]. 2025 May 23:2025.05.19.654863.
doi: 10.1101/2025.05.19.654863.

Decoding protein-peptide interactions using a large, target-agnostic yeast surface display library

Affiliations

Decoding protein-peptide interactions using a large, target-agnostic yeast surface display library

Joseph D Hurley et al. bioRxiv. .

Update in

Abstract

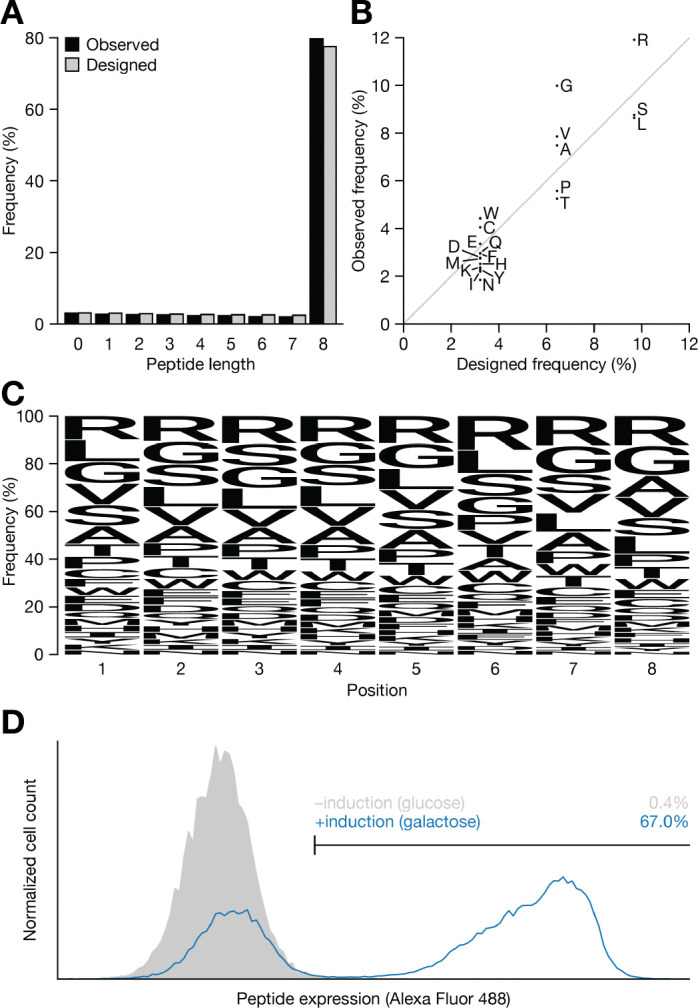
Protein-peptide interactions underlie key biological processes and are commonly utilized in biomedical research and therapeutic discovery. It is often desirable to identify peptide sequence properties that confer high-affinity binding to a target protein. However, common approaches to such characterization are typically low throughput and only sample regions of sequence space near an initial hit. To overcome these challenges, we built a yeast surface displayed library representing ~6.1 × 10⁹ unique peptides. We then performed screens against diverse protein targets, including two antibodies, an E3 ubiquitin ligase, and an essential membrane-bound bacterial enzyme. In each case, we observed motifs that appear to drive peptide binding and we identified multiple novel, high-affinity clones. These results highlight the library's utility as a robust and versatile tool for discovering peptide ligands and for characterizing protein-peptide binding interactions more generally. To enable further studies, we will make the library freely available upon request.


Conflict of interest statement

Competing interests A.C.K. is a cofounder and consultant for Tectonic Therapeutic and Seismic Therapeutic, and for the Institute for Protein Innovation, a nonprofit research institute. The remaining authors declare no competing interests.

Figures

Figure 1.
Figure 1.. Design and assembly of a large, randomized peptide library.
A, Schematic of yeast surface display expression construct. Diversified peptide region (blue) contains eight positions, each of which may encode any of the 20 common amino acids or a stop codon. B, Diversity analysis results from in silico library assembly simulation to assess library diversity and redundancy.
Figure 2.
Figure 2.. Experimental validation of assembled library.
A, Histogram of peptide abundance in the library as a function of peptide length. B, Overall frequency of amino acid usage in the assembled library versus the library design (i.e., the NNK codon distribution). C, Per-position amino acid usage frequencies in the assembled library. D, Representative histogram of naïve yeast library expression as measured by binding to anti-hemagglutinin antibody.
Figure 3.
Figure 3.. Selection campaign against the IgG antibody Rho1D4.
A, Schematic of selection campaign. In MACS round, depletion and enrichment were performed sequentially. B, Representative histogram of per-round binding to 1 μM biotinylated Rho1D4-streptavidin Alexa Fluor 488 complex. C, Per-round Rho1D4 binding as assessed by flow cytometry in titration format. Data are presented as mean ± SEM from three independent technical replicates. D, Rarefaction curves (solid lines) for each round, with extrapolations (dotted lines) shown up to two-fold above the number of observed NGS reads. Chao1 diversity estimators for each round are presented numerically. E, The fraction of NGS reads representing the canonical Rho1D4 epitope (top). The fraction of NGS reads as a function of Levenshtein edit distance from the canonical Rho1D4 epitope (bottom). F, Sequence logos for each round. Residues corresponding to the canonical Rho1D4 epitope are highlighted in red. G, Representative biolayer interferometry sensorgrams for peptides corresponding to the canonical epitope (left) and the round 3 consensus sequence (right). Data are presented as mean kinetic fit KD values ± SEM from three independent technical replicates.
Figure 4.
Figure 4.. Selection campaign against the IgG antibody HPC4.
A, Schematic of selection campaign. In MACS round, depletion and enrichment were performed sequentially. B, Representative histogram of per-round binding to 1 μM biotinylated HPC4-streptavidin Alexa Fluor 488 complex. C, Per-round HPC4 binding as assessed by flow cytometry in titration format. Data are presented as mean ± SEM from three independent technical replicates. D, Rarefaction curves (solid lines) for each round, with extrapolations (dotted lines) shown up to two-fold above the number of observed NGS reads. Chao1 diversity estimators for each round are presented numerically. E, The fraction of NGS reads as a function of Levenshtein edit distance from the canonical HPC4 epitope. F, Sequence logos for each round. The core “DPRL” motif is highlighted in shades of red, with shading corresponding to the register in which the motif appears. G, The fraction of NGS reads containing each possible subsequence of the canonical 12 amino acid HPC4 motif. Subsequence starting residue is designated on the y axis and ending residue on the x axis. Example subsequences are highlighted in black, and core “DPRL” motif is highlighted in red. H, Fraction of NGS reads containing “DPRL” motif as a function of the register in which the motif appears. I, Fraction of clonal yeast cells expressing variants of the HPC4 motif bound at 100 nM HPC4. Data are presented as mean ± SEM from three independent technical replicates.
Figure 5.
Figure 5.. Selection campaign against the E3 ubiquitin ligase KLHDC2.
A, Schematic of selection campaign. B, Representative histogram of perround binding to 1 μM biotinylated KLHDC2-streptavidin Alexa Fluor 488 complex. C, Per-round KLHDC2 binding as assessed by flow cytometry in titration format. Data are presented as mean ± SEM from three independent technical replicates. D, Rarefaction curves (solid lines) for each round, with extrapolations (dotted lines) shown up to two-fold above the number of observed NGS reads. Chao1 diversity estimators for each round are presented numerically. E, The fraction of NGS reads as a function of Levenshtein edit distance from the core C-terminal SelK recognition motif (PMAGG). F, Sequence logos for each round. Residues corresponding to the core SelK recognition motif are highlighted in red. G, Binding of selected peptides in fluorescence polarization assay. Clones chosen randomly from round 2 are shown on left (light blue), and highest abundance clones in the round 4 NGS dataset are shown on right (dark blue). SelK control 8-mer peptide is shown in black. Data are presented as mean ± SEM from three independent technical replicates.
Figure 6.
Figure 6.. Selection campaign against the peptidoglycan synthase RodA-PBP2.
A, Schematic of selection campaign. In MACS rounds, depletion and enrichment were performed sequentially. B, Representative histogram of per-round binding to 400 nM biotinylated RodA-PBP2-streptavidin Alexa Fluor 488 complex. C, Per-round RodA-PBP2 binding as assessed by flow cytometry in titration format. Data are presented as mean ± SEM from three independent technical replicates. D, Rarefaction curves (solid lines) for each round, with extrapolations (dotted lines) shown up to two-fold above the number of observed NGS reads. Chao1 diversity estimators for each round are presented numerically. E, Each peptide’s abundance in the NGS datasets for each selection round. The eight highest abundance sequences in round 4 are shown as solids black lines, the null peptide is shown as a dotted black line, and all other sequences are shown in gray. F, Sequence logos for each round. G, Binding of selected peptides in biolayer interferometry (BLI) assay. Single-concentration BLI responses for the eight highest abundance hits and negative control peptide against RodA-PBP2 and an off-target, PBP1b (left). Table showing the eight highest abundance hit sequences, their calculated hydrophobicities (GRAVY index), and their KD values. KD values are presented as mean equilibrium fit KD values ± SEM from four independent technical replicates.

Similar articles

References

    1. London N., Raveh B. & Schueler-Furman O. Druggable protein-protein interactions--from hot spots to hot segments. Curr. Opin. Chem. Biol. 17, 952–959 (2013). - PubMed
    1. Houen G. Peptide Antibodies: Past, Present, and Future: Methods and Protocols. in Peptide Antibodies (ed. Houen G.) vol. 1348 1–6 (Springer New York, New York, NY, 2015). - PubMed
    1. Berg K. M. C. W. Janeway’s Immunobiology, 10th Edition. (W. W. Norton & Company, NewYork, NY, 2022).
    1. Koren I. et al. The Eukaryotic Proteome Is Shaped by E3 Ubiquitin Ligases Targeting C-Terminal Degrons. Cell 173, 1622–1635.e14 (2018). - PMC - PubMed
    1. Timms R. T. et al. Defining E3 ligase-substrate relationships through multiplex CRISPR screening. Nat. Cell Biol. 25, 1535–1545 (2023). - PMC - PubMed

Publication types

LinkOut - more resources