[Preprint]. 2025 May 23:2025.05.20.650777.
doi: 10.1101/2025.05.20.650777.

Targeting Regnase-1 unleashes CAR T cell antitumor activity for osteosarcoma and creates a proinflammatory tumor microenvironment

Affiliations

Targeting Regnase-1 unleashes CAR T cell antitumor activity for osteosarcoma and creates a proinflammatory tumor microenvironment

Adeleye O Adeshakin et al. bioRxiv. .

Abstract

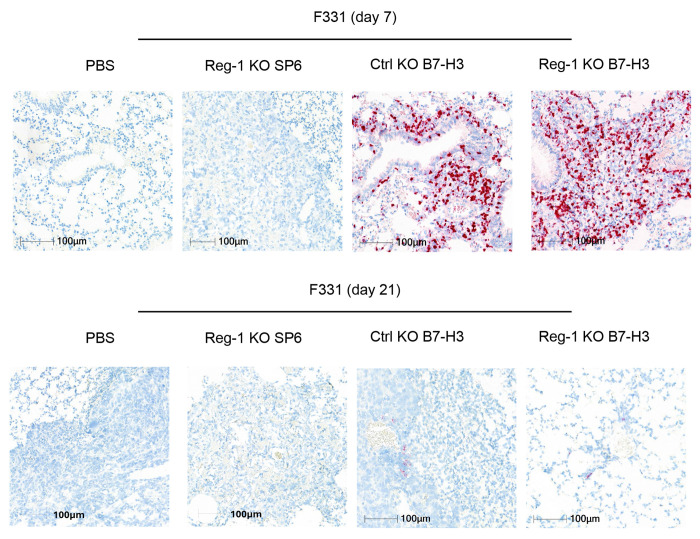
Negative regulators of T cell function represent promising targets to enhance the intrinsic antitumor activity of CAR T cells against solid tumors. However, the endogenous immune ecosystem in solid tumors often represents an immunosuppressive therapeutic barrier to CAR T cell therapy, and it is currently unknown whether deletion of negative regulators in CAR T cells reshapes the endogenous immune landscape. To address this knowledge gap, we developed CAR T cells targeting B7-H3 in immune-competent osteosarcoma models and evaluated the intrinsic and extrinsic effects of deleting a potent negative regulator called Regnase-1 (Reg-1). Deletion of Reg-1 not only improved the effector function of B7-H3-CAR T cells but also endowed them with the ability to create a proinflammatory landscape characterized by an influx of IFNγ-producing endogenous T cells and NK cells and a reduction of inhibitory myeloid cells, including M2 macrophages. Thus, deleting negative regulators in CAR T cells enforces a non-cell-autonomous state by creating a proinflammatory tumor microenvironment.


Conflict of interest statement

Conflict of Interest G.K., C.D., H.C., and S.G are co-inventors on patent applications or patents in the fields of cell or gene therapy for cancer. S.G. is a member of the Scientific Advisory Board of Be Biopharma and the Data and Safety Monitoring Board (DSMB) of Immatics and has received honoraria from CARGO Therapeutics within the last year. H.C. consults for Kumquat Biosciences and TCura Bioscience. All other authors do not declare a conflict of interest.

Figures

Extended data Figure 1:
Extended data Figure 1:. H&E staining of osteosarcoma pulmonary tumor post-CAR T cell infusion
Hematoxylin and eosin (H&E) staining of lungs from mice on day 21 (F331; upper) and day 28 (M1199; lower) after infusion with Reg-1 KO SP6, Ctrl KO or Reg-1 KO B7-H3-CAR T cells or PBS. Representative images. Top rows: 0.6x magnification, 5 mm scale; bottom rows: 20x magnification, 100 μm scale.
Extended data Figure 2:
Extended data Figure 2:. Reg-1 KO improves antitumor activity of B7-H3-CAR T cells in subcutaneous mouse model
(A) Experimental schematic: C57BL/6 mice were implanted with 2x10⁶ F331 subcutaneously on the right flank and on day 14 received a single i.v. dose of 5x10⁶ Reg-1 KO or Ctrl KO B7-H3-CAR T cell infusion. (B) Tumor growth curve (n=5 mice per group). (C) Kaplan-Meier survival curve, log-rank Mantel-Cox test, n=5 mice per group, **:p<0.01.
Extended data Figure 3:
Extended data Figure 3:. B7-H3-CAR T cells are present within pulmonary metastases on day 7 post-infusion
Detection of B7-H3-CAR T cells with an in situ hybridization (ISH) probe specific for the B7-H3-CAR in the F331 model on day 7 (top) and day 21 (bottom) after infusion with Reg-1 KO SP6, Ctrl KO or Reg-1 KO B7-H3-CAR T cells. Fast red chromogen with hematoxylin counterstain. 20x magnification, 100 μm scale.
Extended data Figure 4:
Extended data Figure 4:. Reg-1 KO B7-H3-CAR T cells induced transient splenomegaly, lympho- and monocytopenia on day 7 post injection
(A) Mice were injected with F331 and received indicated CAR T cells as described for Fig. S9A. Spleens weight is shown for days 7 and 21 post CAR T cell infusion (n=3-10 mice per group). (B) Mice were injected with M1199 cells and received indicated CAR T cells as described for Fig. S9B. Weight of spleens on days 7 and 28 post CAR T cell infusion (n=5 mice per group). (C,D) Complete blood count analysis on days 0, 7, 14 and 21 post-CAR T cell infusion in the (C) F331 or (D) M1199 model (n=5-10 mice per group) One way or Two-way ANOVA with Tukey’s test for multiple comparisons; *: p<0.05; **:p<0.01; ****:p<0.0001.
Extended data Figure 5:
Extended data Figure 5:. Reg-1 KO B7-H3-CAR T cells induce infiltration of NK cells
(A, B) Mice were injected with F331 (A) or M1199 (B) cells, followed by infusion with indicated CAR T cells as described in Fig. S9. (A) Percentages of T, NK, B and myeloid cell subsets among CD45.2+ viable cells in the lungs and spleens on day 7 after CAR T cell infusion (n=3 mice per group). (B) Percentages of T, NK, B and myeloid cell subsets among CD45.2+ viable cells in the lungs and spleens on day 7 after CAR T cell infusion (n=5 mice per group). NK: natural killer cell, DC: Dendritic cell. Two-way ANOVA with Tukey’s test for multiple comparisons or unpaired student’s t-test: *:p<0.05, **:p<0.01, ***:p<0.001, ****:p<0.0001.
Extended data Figure 6:
Extended data Figure 6:. Reg-1 KO B7-H3-CAR T cells upregulate PD-1 expression on endogenous T cells and PD-L1 expression on endogenous myeloid cells
(A, B) Mice were injected with (A) F331 (n=3 mice per group) or (B) M1199 (n=5 mice per group) cells, followed by infusion with indicated CAR T cells as described in Fig. S9. Percentages of PD-1+ cells among endogenous CD4+ and CD8+ T cells (left) or PD-L1 expression on indicated myeloid cell populations (right) in lungs and spleens on day 7 post CAR T cell infusion, as evaluated by flow cytometry. Two-way ANOVA with Tukey’s test for multiple comparisons; *:p<0.05, **:p<0.01, ***:p<0.001, ****:p<0.0001.
Extended data Figure 7:
Extended data Figure 7:. Reg-1 KO enhances B7-H3-CAR T cell persistence on day 21 post transfer
Data was pooled from all 7 mice in each condition between both immunophenotyping experiments described for Fig. 4 and Fig. S19. (A) Bar graphs gives the fraction of CAR T cells observed under each treatment condition from total CD45+ cells recovered, showing a unique persistence for Reg-1 KO B7-H3-CAR T cells. (B) Bar graphs gives the fraction of PD-1+PD-L1+ CAR T cells, indicating that nearly all CAR T cells persisting at this time point expressed these markers. Contour plots in (A, B) show co-expression (indicated in red) of Ametrine and CD8 (A) or PD-L1 and PD-1 (B) populations relative to concatenated data from all CD45+ cells (grey); Data from two independent experiments. One-way ANOVA; ****:p<0.0001;
Extended data Figure 8:
Extended data Figure 8:. Reg-1 KO B7-H3-CAR T cells decrease macrophage signatures in osteosarcoma
IHC for a universal-macrophage marker (CD68 staining) or specific markers for M2 macrophages (CD163 and ARG1) in lung tumors from F331 tumor-bearing mice on day 21 after infusion with Reg-1 KO SP6, Ctrl KO or Reg-1 KO B7-H3-CAR T cells. 3,3’-Diaminobenzidine (DAB) chromogen with hematoxylin counterstain. Representative images. 20x magnification, 100 μm scale.
Extended data Figure 9:
Extended data Figure 9:. Reg-1 KO B7-H3-CAR T cells alter endogenous T cell subsets
Cluster distribution of the experiment described in Fig. 4 and Fig. 5G,H. (A, B) The naive, EM and CM subsets of (A) CD4+ and (B) CD8+ T cell clusters from the experiment reported in Fig. 5.G,H and illustrated in Table S2 (n=3 mice per group). Comparison was performed for the Reg-1 KO B7-H3-CAR T treatment condition relative to the Ctrl KO B7-H3-CAR T cell recipients; two-way ANOVA, Tukey’s multiple comparisons test; **:p<0.01; ****:p<0.0001.
Extended data Figure 10:
Extended data Figure 10:. Cytokine production of endogenous T cells post-CAR T cell infusion
Intracellular flow cytometry panel detailed in Table S5 and outlined in methods was conducted on an aliquot of single-cell suspensions from lungs of F331 tumor-bearing mice that received infusion of the indicated CAR T cells, as described in Fig. 4 and Fig. S19. (A,B) Percentages of IL-10, IL-6, TNFα, IL-17A, and RORγ-expressing cells among (A) CD4+ and (B) CD8+ T cells.
Figure 1:
Figure 1:. Reg-1 KO improves the antitumor activity of B7-H3-CAR T cells in vivo
(A) Co-transduction efficiency of indicated sgRNA (ametrine) and CAR in NT, (Ctrl) KO B7-H3-CAR, Reg-1 KO SP6-CAR, or Reg-1 KO B7-H3-CAR T cells evaluated by flow cytometry, n=3–6 pooled from multiple independent experiments (one-way ANOVA with Tukey’s test for multiple comparisons). (B) Insertion and deletion (Indel) analysis of the Reg-1 gene in indicated CAR T cells, n=4–7 pooled from multiple independent experiments (one-way ANOVA with Tukey’s test for multiple comparisons). (C) 3-(4,5-dimethylthiazol-2-yl)-5-(3-carboxymethoxyphenyl)-2-(4-sulfophenyl)-2H-tetrazolium (MTS) assay with B7-H3-positive (F331, M1199) and B7-H3-negative (B7-H3 KO F331) targets at an effector to target (E:T) ratio of 2:1; n=3 (two-way ANOVA with Tukey’s test for multiple comparisons). (D,E) Multiplex analysis of cytokines and chemokines post (D) CAR T-cell production (two-way ANOVA with Tukey’s test for multiple comparisons) and (E) 48 hours after stimulation with F331 cells at 1:1 E:T ratio. Tumor cell and NT T cell group, n=3; all other conditions, n=5. (F–I) C57BL/6 mice (CD45.2+) were injected with 1x10⁶ F331 or 2x10⁵ M1199 OS cells intravenously (i.v.) and on day 7 received a single i.v. dose of the indicated CAR T cell (Cas9+CD45.1+) populations or PBS. (F,G) Experimental schematic (upper), representative macroscopic images of lungs (lower left) and lungs weight (lower right) on (F) day 21 for F331 (n=3 for images) or (G) day 28 for M1199. n=4 per group for images and n=8–10 per group for lungs weight post-T cell infusion. (H,I) Kaplan-Meier survival curve (H) F331, log-rank Mantel-Cox test, n=8 for Reg-1 KO SP6; all other groups, n=13 and (I) M1199, log-rank Mantel-Cox test, n=5 for Reg-1 KO SP6; all other groups, n=10; two-way ANOVA with Tukey’s test for multiple comparisons. *:p<0.05, **:p<0.01, ***:p<0.001, ****:p<0.0001.
Figure 2:
Figure 2:. Reg-1 KO enhances B7-H3-CAR T cell expansion in vivo
C57BL/6 mice were injected with 1x10⁶ F331 or 2x10⁵ M1199 OS cells (i.v.) and on day 7 received a single i.v. dose of the indicated CAR T cell population or PBS. (A–D) Quantification of lungs- and spleens-infiltrating CD8+CD45.1+ T cells on day 7 for (A) F331 or (B) M1199 and (C) day 21 for F331 or (D) day 28 for M1119 post-T cell injection, as evaluated by flow cytometry. F331: n=3 per time point and M1199: n=5 per time point (one-way ANOVA with Tukey’s test for multiple comparisons). (E,F) Phenotyping of lungs- and spleens-infiltrating CAR T cell differentiation states, classified as naïve (CD62L+CD44), effector memory (EM; CD62LCD44+) and central memory (CM; CD62L+CD44+) subsets, in (E) F331 tumor-bearing mice (comparison could not be performed between Ctrl KO and Reg-1 KO due to insufficient Ctrl KO CAR T cells detected in the spleens; #: not done) and (F) M1199 tumor-bearing mice on day 7 post CAR T cell infusion (F331; n=3, M1199: n=5 unpaired student t test). (G) Multiplex analysis of cytokines in the serum on day 7 post treatment with indicated CAR T cells or PBS in the F331 model, n=5 per group (two-way ANOVA with Tukey’s test for multiple comparisons); *:p<0.05; **:p<0.01; ***:p<0.001; ****:p<0.0001.
Figure 3:
Figure 3:. Reg-1 KO enhances pro-inflammatory and metabolic signaling pathways during the expansion phase of B7-H3 CAR T cells in vivo
(A) Experimental schematic: Mice received a single dose of 5x10⁶ Reg-1 KO or Ctrl KO B7-H3-CAR T cells (Cas9+CD45.1+) on day 7 post F331 tumor cell injection. Lungs and spleens were isolated on day 5 post CAR T cell infusion, and cells from 3 mice per condition were pooled for scRNA-seq analysis. (B) Volcano plot showing differentially expressed genes (Log2FC > 0.5 or < −0.5 and adjusted P < 0.05) in Reg-1 KO B7-H3-CAR T cells from the lungs versus spleens. (C) Top 10 significantly (FDR < 0.05) upregulated and top 5 downregulated pathways in Reg-1 KO B7-H3-CAR T cells from the lungs versus spleens, as revealed by gene set enrichment analysis (GSEA) using Hallmark gene sets. (D) Uniform Manifold Approximation and Projection (UMAP) of Reg-1 KO or Ctrl KO B7-H3 CAR T cells (left) and Hvacr2 (encoding TIM-3) or Tcf7 (encoding TCF1) expression (right) in the lungs. (E) Proportion of Havcr2 and Tcf7 in the Reg-1 KO and Ctrl KO B7-H3-CAR T cells in the lungs. (F) Upregulated (red) or downregulated (blue) genes (log2FC > 0.5 and adjusted P < 0.05) in Reg-1 KO B7-H3-CAR T cells compared to Ctrl KO B7-H3-CAR T cells. (G) Top 10 significantly (FDR < 0.05) upregulated and top 2 downregulated metabolism-related pathways (from Hallmark gene sets; left) or top 10 upregulated and downregulated GO biological pathways (right) in Reg-1 KO B7-H3-CAR T cells compared to Ctrl KO B7-H3-CAR T cells, as revealed by GSEA. (H) Ingenuity pathway analysis of transcriptional regulators of Reg-1 KO B7-H3-CAR T cells compared to Ctrl KO B7-H3-CAR T cells in the lungs. (I) Activity score of a CD8+ ZNF683+CXCR6+ tissue-resident memory T cell signature in Ctrl KO and Reg-1 KO B7-H3-CAR T cells in the lungs. ET: electron transport; ETC: electron transport chain; MRC: mitochondrial respiratory chain; PROTRPSTK: positive regulation of transmembrane receptor protein serine threonine kinase; REG: regulation; RESP: respiration; MST: mediated signal transduction.
Figure 4:
Figure 4:. Global immune landscape changes post B7-H3-CAR T cell infusion
C57BL/6 mice (CD45.2+) were injected with 1x10⁶ F331 cells (i.v.) and on day 7 received a single i.v. dose of edited CAR T cells (Cas9+CD45.1+Ametrine+) population or PBS. On day 21 post CAR T cell infusion, mice were euthanized and lungs isolated for high dimensional flow cytometry analysis using a panel including 19 unique immune cell markers. An unbiased algorithm based opt-SNE analysis was performed on 26,000 viable CD45+ lung cell isolates per sample, followed by an unguided clustering in Flow-SOM utilizing elbow metaclustering. (A,B) Concatenated data from the lungs of 12 mice. (A) Heatmaps presenting the relative mean fluorescence intensity of the immune markers assayed, localized across the t-SNE clusters. (B) t-SNE cluster grouping according to immune subtypes based on root phenotypic marker expression as illustrated in Fig S17 and detailed in Table S2. (C) t-SNE plots for indicated treatment conditions (n=3 mice per condition) displaying contributions of each test group to the concatenated data given in other panels, and illustrating distinct cluster aggregations between groups. (D) Fraction of CD45+ cells assigned to each immune cell subset, given as the mean from the 3 individuals in the indicated treatment group. t-SNE, t-distributed stochastic neighbor embedding. DC: dendritic cells, cDC1: conventional DC1, pDC: plasmocytoid DC.
Figure 5:
Figure 5:. Reg-1 KO B7-H3-CAR T cells reduce endogenous inhibitory myeloid cells and increase pro-inflammatory immune cells
Extracellular marker expression data was pooled from the 2 high-parameter immunophenotyping experiments described for Fig. 4 and Fig. S19, totaling 7 lungs samples for each of the 4 indicated treatment conditions. Separate aliquots of lungs cell suspensions from all 28 mice treated in these studies were also probed with the intracellular flow cytometry panel (detailed in Table S5), as outlined in methods. (A) Percentages of indicated myeloid cell subsets, as identified based on the scheme outlined in Fig. S17. (B) Three M1 and (C) nine M2 macrophage clusters were identified, p <0.05 are shown for Ctrl KO versus B7-H3-CAR T cell comparison. (D) Frequencies of ARG1-expressing CD11b+ F4/80+ cells (total macrophages). (E) Percentages and (F) identified clusters of NK cells. In F, p values less than <0.05 are shown for Ctrl KO versus Reg-1 KO B7-H3-CAR T cell comparison. (G–L) Percentages of (G,H) naïve, EM, and CM populations, (I,J) BATF-expressing, or (K,L) IFNγ-expressing cells among CD4+ T cells (G,I,K) or CD8+ T cells (H,J,L), n=7 (G,H,K,L) or n = 4 (I,J) (two-way ANOVA with Tukey’s test for multiple comparisons) *:p<0.05; **:p<0.01; ***:p<0.001; ****:p<0.0001. EM: effector memory, CM: central memory. For panels B, C, and F data is shown for flow cytometric analysis (n=3).
Figure 6:
Figure 6:. Reg-1 KO B7-H3-CAR T cells increase the effector function on endogenous T and NK cells
(A) Experimental schematic: C57BL/6 mice (CD45.2+) received a single dose of 1x10⁶ Reg-1 KO or Ctrl KO B7-H3- CAR T cells (Cas9+CD45.1+) on day 7 post F331 tumor cell injection. Lungs from two mice in each treatment groups were isolated on day 21 post CAR T cell infusion and processed individually for single cell RNA sequencing. (B) UMAP indicating clusters of immune cell subsets identified in lungs infiltrating CD45+ cells with fibroblast and endothelial cells from Reg-1 KO and Ctrl KO B7-H3-CAR T cells treated mice. (C) Percentage of indicated immune cells in lung infiltrating CD45+ cells on day 21 post CAR T cell infusion. (D) Volcano plot showing upregulated genes in endogenous Cd8+ T cells in the lungs of Reg-1 versus Ctrl KO B7-H3-CAR T cell treated mice. (E) Top 9 significantly (FDR < 0.05) upregulated Cd8+ T cell related pathways in lung-infiltrating endogenous CD8+ T cells from Reg-1 KO versus Ctrl KO B7-H3-CAR T cell-treated mice. (F) UMAP projection (left) and Foxp3 expression (right) in lung-infiltrating endogenous CD4+ T cells in Reg-1 KO and Ctrl KO B7-H3-CAR T cell-treated. (G) Volcano plot illustrating upregulated genes in lungs infiltrating Foxp3 negative CD4+ T cells from Reg-1 KO vs Ctrl KO B7-H3-CAR T cell treated mice. (H) Expression of Pdcd1 (encoding PD-1), Lag3 and Havcr2 (TIM-3) on Cd8+ (top) and CD4+ (bottom) T cells in the lungs of Reg-1 KO vs Ctrl KO B7-H3-CAR T cell treated. (I) Fraction of indicated Cd8+ (top) and CD4+Foxp3 (bottom) T cell subsets in the lungs of Ctrl KO and Reg-1 KO B7-H3-CAR T cell-treated mice. (J) Clonal expansion of lungs-infiltrating endogenous CD8+ and CD4+Foxp3T cells in Reg-1 KO and Ctrl KO B7-H3-CAR T cell-treated mice.
Figure 7:
Figure 7:. Reg-1 KO B7-H3-CAR T cells suppress tumor-promoting macrophages
(A) UMAP projection of fibroblasts in the lungs after infusion with Reg-1 KO or Ctrl KO B7-H3-CAR T cells (n=2); genotype (top) or clusters (botton) are illustrated. (B) Absolue cell numbers of fibroblast clusters. (C) Significantly (FDR < 0.05) upregulated and top 14 downregulated pathways in fibroblasts, based on GSEA with Hallmark gene sets. (D) UMAP projection of 10 unique clusters of macrophages in the lungs of mice on day 21 post Reg-1 KO or Ctrl KO B7-H3-CAR T cell infusion (n=2). (E) UMAP projection showing the distribution of macrophages in the lungs of mice post Reg-1 KO or Ctrl KO B7-H3-CAR T cell infusion (color coded by genotype). (F) Cell number (left) and fraction (right) of 10 distinct macrophage clusters in the lungs on day 21 post Reg-1 KO or Ctrl KO B7-H3-CAR T cell infusion. (G) Dot plot indicating expression levels of M1 or M2 macrophage-associated genes in the clusters. (H) Activity scores for M2 (left) and M1 (right) macrophage-related gene signatures in total macrophages from the lungs post Reg-1 KO or Ctrl KO B7-H3-CAR T cell infusion. (I) Upregulated and downregulated genes (Log2FC > 0.5 and adjusted p < 0.05) in total macrophages. (J) Top 4 significantly (FDR < 0.05) upregulated and top 8 downregulated pathways in total macrophages post Reg-1 KO vs. Ctrl KO B7-H3-CAR T cell infusion, based on GSEA using Hallmark gene sets. (K) Decreased and increased signaling pathways identified from the interaction of macrophages and CD8+ T cells by CellChat ligand-receptor interaction prediction. (L) MDSC signature in macrophages from the lungs showing a significant difference post Reg-1 KO or Ctrl KO B7-H3-CAR T cell infusion.

References

    1. Brudno J.N., Maus M.V. & Hinrichs C.S. CAR T Cells and T-Cell Therapies for Cancer: A Translational Science Review. Jama 332, 1924–1935 (2024). - PMC - PubMed
    1. Uslu U. & June C.H. Beyond the blood: expanding CAR T cell therapy to solid tumors. Nat Biotechnol (2024). - PubMed
    1. Wagner J., Wickman E., DeRenzo C. & Gottschalk S. CAR T Cell Therapy for Solid Tumors: Bright Future or Dark Reality? Mol Ther 28, 2320–2339 (2020). - PMC - PubMed
    1. Albelda S.M. CAR T cell therapy for patients with solid tumours: key lessons to learn and unlearn. Nat Rev Clin Oncol 21, 47–66 (2024). - PubMed
    1. Del Bufalo F., et al. GD2-CART01 for Relapsed or Refractory High-Risk Neuroblastoma. N Engl J Med 388, 1284–1295 (2023). - PubMed

Publication types