[Preprint]. 2025 May 21:2025.05.20.654652.
doi: 10.1101/2025.05.20.654652.

Synaptic proteins that aggregate and degrade slower with aging accumulate in microglia

Affiliations

Synaptic proteins that aggregate and degrade slower with aging accumulate in microglia

Ian H Guldner et al. bioRxiv. .

Abstract

Neurodegenerative diseases affect 1 in 12 people globally and remain incurable. Central to their pathogenesis is a loss of neuronal protein maintenance and the accumulation of protein aggregates with aging1,2. We engineered bioorthogonal tools3 which allowed us to tag the nascent neuronal proteome and study its turnover with aging, its propensity to aggregate, and its interaction with microglia. We discovered neuronal proteins degraded on average twice as slowly between 4- and 24-month-old mice with individual protein stability differing between brain regions. Further, we describe the aged neuronal 'aggregome' encompassing 574 proteins, nearly 30% of which showed reduced degradation. The aggregome includes well-known proteins linked to disease as well as a trove of proteins previously not associated with neurodegeneration. Unexpectedly, we found 274 neuronal proteins accumulated in microglia with 65% also displaying reduced degradation and/or aggregation with age. Among these proteins, synaptic proteins were highly enriched, suggesting a cascade of events emanating from impaired synaptic protein turnover and aggregation to the disposal of these proteins, possibly by the engulfment of synapses by microglia. These findings reveal the dramatic loss of neuronal proteome maintenance with aging which could be causal for age-related synapse loss and cognitive decline.


Figures
Extended Data Figure 1:
Extended Data Figure 1:. Evaluation of Nascent Proteome Labeling by Different BONCAT Mouse Lines
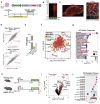
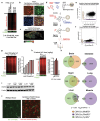
a. In-gel fluorescence image of Alexa 647-clicked and thus BONCAT labeled proteins of total brain lysates derived from young Camk2aCre;MetRS* model and its respective background control. These mice were provided 30mM ANL in water for 2 weeks while on a low methionine diet as reported in a protocol using the same BONCAT mouse line by the originators of the MetRS mouseline. b. Fluorescence images of Alexa 488-clicked and thus BONCAT labeled proteins in cortical tissue sections from young Camk2aCre;PheRS* model. Tissues are co-stained with anti-GFP, which should be co-expressed in all cells expressing PheRS*, and DAPI. c. In situ heatmap of Camk2a mRNA expression from the Allen Brain Atlas. d. Schematic of methodology used to enrich BONCAT-labeled proteins from total lysates for LC-MS. e. Scatter plot showing correlation of −log10 p values of proteins identified in the Camk2aCre;PheRS* model versus the Camk2aCre;MetRS* model. f. Scatter plot showing correlation of −log2 fold change (BONCAT/background control) of proteins identified in the Camk2aCre;PheRS* model versus the Camk2aCre;MetRS* model. g. In-gel fluorescence image of Alexa 647-clicked and thus BONCAT labeled proteins of total brain lysates derived young Camk2aCre;PheRS* mice provided 185mg/kg of azido-phenylalanine (AzF) for a varying number of days (left) and associated quantification of fluorescence intensity of clicked-protein normalized to total protein with the different number of days provided AzF (right). h. In-gel fluorescence image of Alexa 647-clicked and thus BONCAT labeled proteins of total brain lysates derived from young Camk2aCre;PheRS* mice provided varying doses of azido-phenylalanine (AzF) for one week (left) and associated quantification of fluorescence intensity of clicked-protein normalized to total protein with the different doses of AzF provided (right). i. Western blot image of HSP90 and loading control beta-actin on whole brain lysates derived from various BONCAT-labeled models and ages and respective non-labeled controls to show whether BONCAT-labeling induces an HSP90-mediated heat shock response. j. Fluorescence images for microglia (Iba1, green) staining in cortical tissue sections of wildtype, non-BONCAT labeled mice (left) and Camk2aCre;PheRS* BONCAT-labeled mice (right) to show whether BONCAT-labeling induces microgliosis as evaluated by cellular morphology. k. Venn Diagrams showing the overlap and exclusivity of proteins labeled by the CMVCre;MetRS*, CMVCre;PheRS*, and CMVCre;TyrRS* models in the indicated tissues. n = 2 biological replicates per group. Only proteins with a log2 fold change (BONCAT/background control) > 1 and p value < 0.05 were considered in this analysis.
Extended Data Figure 2:
Extended Data Figure 2:. Evaluation of Nascent Proteome Labeling by AAV-Based Delivery of PheRS*
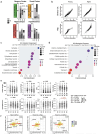
a. Schematic of AAV-expression construct for Camk2a promoter-driven expression of PheRS* (top) and experimental timeline of transduction and proteome labeling (bottom). b. In-gel fluorescence image of Alexa 647-clicked and thus BONCAT labeled proteins of total brain lysates derived from young (3 months) AAV-Camk2a;PheRS* transduced-mice and the respective background controls. c. Fluorescence images of Alexa 594-clicked and thus BONCAT labeled proteins in brain tissue sections from young AAV-Camk2a;PheRS* transduced-mice. The image on the right shows co-staining for neurons (NeuN, green) to show overlap between click signal and neurons as would be expected from this model. d. Scatter plots showing the correlation of −log2 fold change (BONCAT/background control) (top) and −log10 p values (bottom) of proteins identified in young Camk2aCre;PheRS* transgenic mouse model compared to that of the young AAV-Camk2a;PheRS* model. Only proteins commonly detected with a log2 fold change over respective wildtype background controls and p value < 0.05 were plotted. e. Bar chart showing the number of proteins identified by LC-MS commonly and exclusively in the young Camk2aCre;PheRS* transgenic mouse model and young AAV-Camk2a;PheRS* model. Only proteins with a log2 fold change over respective wildtype background controls and p value < 0.05 were used. f. Color-coded volcano plot showing the enrichment of BONCAT-labeled proteins identified by LC-MS in the young AAV-Camk2a;PheRS* model relative to the wildtype background control. Proteins are color-coded by cell type enrichment. g. Gene Ontology Cellular Component analysis on BONCAT labeled proteins in the young AAV-Camk2a;PheRS* BONCAT model. Proteins used in the analysis had a log2 fold change > 1 over the respective background control with a p value < 0.05. h. Schematic of AAV-Camk2a;PheRS* transduction and labeling in an experiment to compare nascent neuronal proteomes of young (3m) and aged mice (21m). n = 4 biological replicates per BONCAT-labeled sample per experimental group, n = 3 biological replicates per background control sample per experimental group. i. Volcano plot of neuronal proteins differentially expressed between young and aged mice. j. Gene Ontology Biological Process analysis on neuronal proteins downregulated in aged mice relative to young mice. Downregulated proteins were those with a log2 fold change < 0 and p value < 0.05, color-coded in blue in (i).
Extended Data Figure 3:
Extended Data Figure 3:. Analysis of Neuronal Protein Half-life with Aging
a. Bar charts showing the average percent reduction of neuronal protein abundance between consecutive time points for each age in each region analyzed. Bars should be interpreted as follows: wherever the top of the bar reaches along the y axis is the percent represented by that bar. b. Scatter plots showing the correlation of neuronal protein half-life in days estimated by modeling versus directly interpolated from the kinetic degradation plots. Only proteins that reached or surpassed 50% remaining are plotted because direct interpolation can only measure such proteins. c. Gene Ontology Cellular Component analysis of neuronal proteins from the sensory cortex within the top 10% greatest fold change (reduced degradation) from young to aged. d. Gene Ontology Biological Processes analysis of neuronal proteins from the sensory cortex within the top 10% greatest fold change (reduced degradation) from young to aged. e. Box and whisker plots comparing properties of neuronal protein from the sensory cortex within different quartiles of half-life fold change with aging. P values derived from a one-way ANOVA with significant comparisons identified by a Tukey test. f. Scatter plots comparing the log2 fold change of estimated protein half-lives (young to aged) between proteins commonly detected between the indicated regions. Each dot represents one protein with the color coding representing the absolute value of the difference between log2 fold changes of protein half-life between the indicated regions. Proteins with an absolute value difference >1 were considered regionally vulnerable.
Extended Data Figure 4:
Extended Data Figure 4:. Clustering of Protein Kinetic Degradation Trajectories
a. Elbow plots of cluster number by minimum centroid distance used to determine cluster number for subsequent clustering analyses of young kinetic degradation trajectories with cluster cutoff indicated by a red dotted line (left) and associated clustering and overlap of young and aged kinetic degradation trajectories of the indicated brain regions. Protein membership in the aged clusters was determined by the clustering of young samples to serve as a baseline. The average delta integral, calculated by averaging the difference of the integral values of each aged and young protein within the cluster, is reported on each plot. The p value was determined by a one-way ANOVA with significant comparisons identified by a Tukey test (right). b. Heatmap of the top 5 most significant Gene Ontology Biological Processes identified for each cluster in the young visual cortex (left), hippocampus (middle), and hypothalamus (right). Heatmap colors represent −log10 of the FDR for each pathway. c. Bar plot comparing the integral values of young, middle-aged, and aged proteins on a per-region basis. P value determined by a one-way ANOVA with significant comparisons identified by a Tukey test.
Extended Data Figure 5:
Extended Data Figure 5:. Analysis of Aged Neuronal Protein Aggregates
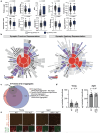
a. Box and whisker plots comparing properties of neuronal protein from the sensory cortex identified in aged neuronal aggregates compared to those not identified in aged neuronal aggregates. P values derived from a one-way ANOVA with significant comparisons identified by a Tukey test. b. Sunburst plots showing synaptic functional representation (left) and synaptic anatomical representation (right) of neuronal proteins identified in aged protein aggregates. c. Venn Diagram showing the overlap of neuronal proteins identified in aged protein aggregates by BONCAT methodology with proteins identified in aged protein aggregates without labeling methodology by us and an independent publication by Molzahn et al. d. Bar charts comparing mass of insoluble protein/protein aggregates between young Camk2aCre;PheRS* mice provided azido-phenylalanine (AzF) and young wildtype mice not provided AzF (left) and aged AAV-Camk2a;PheRS* transduced mice provided azido-phenylalanine (AzF) and aged wildtype mice not provided AzF (right). e. Fluorescence images comparing protein aggregate (Proteostat, orange) between young Camk2aCre;PheRS* mice provided azido-phenylalanine (AzF) and young wildtype mice not provided AzF (left) and aged AAV-Camk2a;PheRS* transduced mice provided azido-phenylalanine (AzF) and aged wildtype mice not provided AzF (right).
Extended Data Figure 6:
Extended Data Figure 6:. Analysis of Synaptic Proteins Found in Brain Macrophages
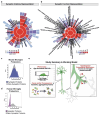
a. Sunburst plots showing synaptic anatomical representation of neuronal proteins identified in microglia. b. Sunburst plots showing synaptic functional representation of neuronal proteins identified in microglia. c. Density plot comparing the abundance of synaptic proteins and non-synaptic proteins in mouse microglia measured by LC-MS from Lloyd et al. d. Density plot comparing the abundance of synaptic proteins and non-synaptic proteins in human microglia measured by LC-MS from Lloyd et al. e. Schematic of study summary and working model.
Figure 1:
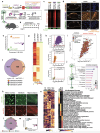
Figure 1:. Evaluation of Nascent Proteome Labeling of Camk2a+ Excitatory Neurons by BONCAT Mouse Lines
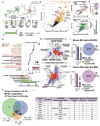
a. Schematics of transgenes to permit mutant amino-acyl tRNA synthetase (aaRS) expression in mice to allow bioorthogonal non-canonical amino acid tagging (BONCAT) and the mechanism of nascent proteome labeling in BONCAT mice. b. Timeline of non-canonical amino acid (NCAA)/azido-amino acid (azAA) administration for nascent proteome tagging in BONCAT transgenic mice. c. In-gel fluorescence image of Alexa 647-clicked and thus BONCAT labeled proteins from total brain lysates derived from young Camk2aCre;MetRS*, Camk2aCre;PheRS*, and Camk2aCre;TyrRS* BONCAT transgenic mice and their respective wildtype background controls. Relative Alexa 647 intensities can be taken as a measure of relative labeling efficiencies. d. Fluorescence images of Alexa 555-clicked and thus BONCAT labeled proteins in brain tissue sections from young Camk2aCre;MetRS*, Camk2aCre;PheRS*, and Camk2aCre;TyrRS* BONCAT transgenic mice. e. Principal component analysis based on the abundance of BONCAT labeled proteins from young Camk2aCre;MetRS*, Camk2aCre;PheRS*, and Camk2aCre;TyrRS* BONCAT transgenic mice as determined by LC-MS. Proteins not identified in one group but identified in others were maintained for analysis and values imputed. n = 4 mice per experimental group. f. Venn Diagram comparing the number of different proteins commonly and exclusively identified by LC-MS in young Camk2aCre;MetRS*, Camk2aCre;PheRS*, and Camk2aCre;TyrRS* BONCAT transgenic mice. n = 4 mice per experimental group. Proteins used in the comparison had a log2 fold change > 1 over the respective background control with a p value < 0.05. g. Heatmap comparing −log10 p values of identified proteins in young Camk2aCre;MetRS*, Camk2aCre;PheRS*, and Camk2aCre;TyrRS* BONCAT transgenic mice. n = 4 mice per experimental group. Proteins not identified in a particular line were assigned a −log10 p value of 0. h. Volcano plots showing the relative abundance and p values of proteins detected by LC-MS in young Camk2aCre;MetRS*, Camk2aCre;PheRS*, and Camk2aCre;TyrRS* BONCAT transgenic mice relative to their respective wildtype background controls. n = 4 mice per experimental group. Each volcano plot can be taken as a measure of the signal-to-noise ratio between each BONCAT mouse line and the respective background control. i. Color-coded volcano plot showing the enrichment of BONCAT-labeled proteins identified by LC-MS in young Camk2a-Cre;PheRS* BONCAT mouse line relative to the respective wildtype background control. n = 4 mice per experimental group. Proteins are color-coded by cell type enrichment. j. Gene Ontology Cellular Component analysis on BONCAT labeled proteins in young Camk2a-Cre;PheRS* BONCAT mouse line. Proteins used in the analysis had a log2 fold change > 1 over the respective background control with a p value < 0.05. k. Fluorescence images of Alexa 488-clicked and thus BONCAT labeled proteins in motor cortex, striatum, and hippocampus of brain tissue sections from young Camk2a-Cre;PheRS* BONCAT mouse line. l. Venn Diagram comparing the number of different proteins commonly and exclusively identified by LC-MS in the motor cortex, hippocampus, and striatum of young Camk2a-Cre;PheRS* BONCAT mouse line. n = 4 mice per experimental group. Proteins used in the comparison had a log2 fold change > 1 over the respective region background control with a p value < 0.05. m. Principal component analysis based on the abundance of BONCAT labeled proteins from the motor cortex, striatum, and hippocampus of young Camk2a-Cre;PheRS* BONCAT mouse line as determined by LC-MS. n = 4 mice per experimental group. n. Heatmap with hierarchical clustering comparing the z-scored abundance of BONCAT-labeled proteins from the motor cortex, striatum, and hippocampus of young Camk2a-Cre;PheRS* BONCAT mouse line. Protein clusters enclosed by a white dotted line are considered region marker proteins. o. Heatmap comparing pathway fold enrichment of the top 10 Gene Ontology Biological Processes of the motor cortex, striatum, and hippocampus based on the region marker proteins shown in (n). Only pathways with an FDR < 0.05 were considered in the analysis.
Figure 2:
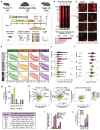
Figure 2:. Neuronal Protein Degradation Slows with Aging and is Regionally Heterogeneous
a. Schematic of the experimental approach to study protein degradation with aging using BONCAT methodology. n = 4 mice per timepoint for each age. b. In-gel fluorescence image of Alexa 647-clicked and thus BONCAT labeled proteins of total brain lysates derived from Camk2a-Cre;PheRS* BONCAT mice at the indicated time points in the chase period following labeling of proteins with azido-phenylalanine. c. Fluorescence images of Alexa 594-clicked and thus BONCAT labeled proteins in cortex of brain tissue sections from the Camk2a-Cre;PheRS* BONCAT mice at the indicated time points in the chase period following labeling of proteins with azido-phenylalanine. d. Kinetic degradation trajectories of the percent of BONCAT-labeled protein remaining through the chase period following labeling of proteins with azido-phenylalanine in the indicated brain regions and ages. Each fine line represents one protein derived from averaging four biological replicates. The single bold line outlined in white represents the average of all proteins. Proteins were plotted irrespective of age-based or regionally-based overlap and only filtered to exclude proteins that displayed a 5% increase between any two time points. e. Plot of the estimated protein half-life in days for the indicated brain regions and ages. Each dot represents one protein. For each individual brain region, only proteins commonly identified between all ages of that region are plotted. P value determined by paired t-test between young and aged proteins. *** p < 0.0001 f. Plot of log2 fold change of estimated protein half-life values between the indicated brain regions and ages. Each dot represents one protein and is the same as those displayed in (f). P value determined by paired t-test between young and aged proteins. g. Bar plot of the number of proteins with an age-increased half-life (age vs young fold change > 1.5) that are also H-MAGMA risk genes for the indicated brain disorders. Risk genes were derived from the H-MAGMA study and considered only if the reported p value was < 0.05 (top). Table of the top 5 most half-life increased risk genes with age in the sensory cortex (bottom). h. Scatter plots comparing the log2 fold change of the estimated protein half-lives (young to aged) between proteins commonly detected between the sensory cortex versus the hippocampus (left), hypothalamus (middle), and visual cortex (right). Each dot represents one protein with the color coding representing the absolute value of the difference between log2 fold changes of protein half-life between the indicated regions. Proteins with an absolute value difference >1 were considered regionally vulnerable. i. Bar plot of the number of regionally-vulnerable proteins between the indicated regions. As in (h), proteins with an absolute value difference >1 were considered regionally vulnerable. j. Bar plot of the number of H-MAGMA neurodegenerative risk genes within the identified regionally-vulnerable proteins for each region analyzed. As in (g), risk genes were derived from the H-MAGMA study and considered only if the reported p value was < 0.05. As in (h), proteins with an absolute value difference >1 were considered regionally vulnerable.
Figure 3:
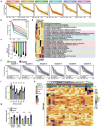
Figure 3:. The Coordinated Degradation of Proteins by Biological Function Is Differentially Compromised with Aging
a. Kinetic degradation trajectories of the six clusters identified by unbiased clustering of all protein degradation trajectories of the young (4 months) sensory cortex. Red lines represent proteins closer to the average trajectory of the cluster while yellow lines represent those farther away from the average of the cluster. b. Plot of the average degradation trajectory for each cluster visualized in (a) from the young sensory cortex. c. Bar plot comparing the slopes of the kinetic degradation trajectories of each protein in each cluster for the young sensory cortex. Each dot represents the slope of the kinetic degradation trajectory of one protein. P value determined by a one-way ANOVA with significant comparisons identified by a Tukey test. d. Heatmap of the top 5 most significant Gene Ontology Biological Processes identified for each cluster in the young sensory cortex. Heatmap colors represent −log10 of the FDR for each pathway. e. Overlap of young (4 months) and aged (24 months) kinetic degradation trajectories of the six clusters identified in the sensory cortex with lines color-coded by age. Protein membership in the aged clusters was determined by the clustering of young samples to serve as a baseline. The average delta integral, calculated by averaging the difference of the integral values of each aged and young protein within the cluster, is reported on each plot. The p value was determined by a one-way ANOVA with significant comparisons identified by a Tukey test. f. Bar plot comparing the integral values of young and aged proteins within each cluster of the sensory cortex. Each dot represents the integral value for one protein within the indicated cluster. P value determined by a two-tailed t-test. *** p < 0.0001. g. Bar plot comparing the integral values of young and aged proteins on a per-region basis. P value determined by a two-tailed t-test. *** p < 0.0001. h. Heatmap of the top 5 most significant Gene Ontology Biological Processes identified for each cluster in each brain region examined. Regions and respective clusters are indicated at the top of the heatmap. Heatmap colors represent −log10 of the FDR for each pathway. The annotation at the top of the heatmap represents the delta integral of the indicated region/cluster.
Figure 4:
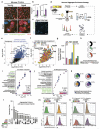
Figure 4:. Aggregating Neuronal Proteins in Aged Brains Have Links to Age-Related Degradation Deficits, Synaptic Dysregulation, and Proteinopathies
a. Fluorescence images of young (4 months) and aged (24 months) mouse cortex tissue sections stained for neurons (NeuN, red) and protein aggregates (Proteostat, green). b. Quantification comparing aggregate number (left) and area (right) between young and aged mouse cortices. P value determined by two tailed t test. c. Fluorescence images of old human brain tissue section stained for protein aggregates (Proteostat, green). d. Schematic of the experimental approach to determine the identity of neuronal proteins in aggregates from the aged (22 months) mouse brain. n = 3 mice per experimental group. e. Volcano plot showing the enrichment of BONCAT-labeled neuronal proteins in aged protein aggregates identified by LC-MS relative to the wildtype background control. Proteins with a log2 fold change > 0 over wildtype background controls with a p value < 0.05 are considered hits. f. Color-coded volcano plot showing the enrichment of BONCAT-labeled neuronal proteins in aged protein aggregates identified by LC-MS relative to the wildtype background control. Proteins are color-coded based on the disease or disorder for which they have been identified as risk genes. Risk genes were derived from the H-MAGMA study and considered only if the reported p value was < 0.05/ g. Bar plot of the number of aggregating neuronal proteins in aged brains that are also H-MAGMA risk genes of the indicated brain diseases and disorders. Risk genes were derived from the H-MAGMA study and considered only if the reported p value was < 0.05. h. Donut plots showing the percentage of all aggregating neuronal proteins in aged brains that are risk genes of both neurodegenerative diseases and neurodevelopmental disorders (top), only neurodegenerative diseases (middle), or only neurodevelopmental disorders (bottom). Risk genes were derived from the H-MAGMA study and considered only if the reported p value was < 0.05. i. Gene Ontology Cellular Component analysis on all aggregating neuronal proteins in aged brains. Cellular component terms in green font highlight synaptic terms. Proteins used in the analysis had a log2 fold change > 0 over the respective background control with a p value < 0.05. j. Gene Ontology Biological Processes analysis on all aggregating neuronal proteins in aged brains. Cellular component terms in green font highlight synaptic terms. Proteins used in the analysis had a log2 fold change > 0 over the respective background control with a p value < 0.05. k. Donut plots showing the percentage of all proteins with an age-increased half-life in the sensory cortex (top left), visual cortex (bottom left), hippocampus (top right), and hypothalamus (bottom right) that were also identified in aged protein aggregates. l. Upset plot showing the overlap of aggregating neuronal proteins with age-increased half-lives between the indicated brain regions. m. Density plot comparing the log2 fold change in half-life from young to aged of aggregating neuronal proteins compared to proteins not identified as aggregated for the sensory cortex (top left), hippocampus (bottom left), visual cortex (top right), and hypothalamus (bottom right). P value determined by Kolmogorov-Smirnov Test. n. Density plots comparing protein half-life of aged proteins identified in aggregates compared to proteins not identified as aggregated for the sensory cortex (top left), hippocampus (bottom left), visual cortex (top right), and hypothalamus (bottom right). P value determined by Kolmogorov-Smirnov Test.
Figure 5:
Figure 5:. Neuronal Proteins Transferred to Microglia are Predominated by Synaptic Identity and Have Age-Related Proteostasis Aberrations
a. Schematic of the experimental approach to identify BONCAT-labeled neuronal proteins in or on microglia (MG) from young (3 months) Camk2aCre;PheRS* mice. n = 3 replicates per group with each replicate being the brains pooled from 3 mice. b. Volcano plot showing the enrichment of BONCAT-labeled neuronal proteins in microglia identified by LC-MS relative to the wildtype background control. Proteins with a log2 fold change > 0 over wildtype background controls with a p value < 0.05 are considered hits. c. Color-coded volcano plot showing the enrichment of BONCAT-labeled neuronal proteins in microglia identified by LC-MS relative to the wildtype background control. Proteins are color-coded based on the likelihood of being a canonically secreted protein as determined by signal peptide score, a score that indicates the likelihood of having a signal peptide sequence. Signal peptide scores > 0.1 are considered secreted. Signal peptide scores < 0.1 but > 0.02 are considered likely secreted. Signal peptide scores < 0.02 are considered unlikely to be secreted. d. Plot showing the signal peptide score of all neuronal proteins identified as being transferred to microglia. e. Color-coded volcano plot showing the enrichment of BONCAT-labeled neuronal proteins in microglia identified by LC-MS relative to the wildtype background control. Proteins are color-coded based on being reported as exosome cargo by Exocarta. f. Bar plot of the number of neuronal proteins transferred to microglia that are either classically secreted or reported exosome cargo. g. Gene Ontology Cellular Component analysis on all neuronal proteins transferred to microglia. Proteins used in the analysis had a log2 fold change > 0 over the respective background control with a p value < 0.05 (top). Bar chart of the number of proteins identified in the dataset that contribute to the indicated gene ontology terms and the percent of the gene list represented by the identified proteins (bottom). h. Sunburst plots showing synaptic functional representation (top) and synaptic anatomical representation (bottom) of neuronal proteins identified in microglia. i. Bar plot of the number of proteins identified in the mouse microglia proteome and the number of those proteins within the Gene Ontology Synapse gene list (left) and Venn Diagram showing the overlap of proteins identified in the entire mouse microglia proteome and the neuron-derived proteins we identified in microglia. j. Bar plot of the number of proteins identified is the human microglia proteome and the number of those proteins within the Gene Ontology Synapse gene list (left) and Venn Diagram showing the overlap of proteins identified in the entire human microglia proteome and the neuron-derived proteins we identified in microglia. k. Venn Diagram showing the overlap of neuronal proteins identified to have a reduction in degradation with age (green), identified in aged aggregates (blue), and transferred to microglia (yellow). Over enrichment of overlapping proteins and associated p values derived from hypergeometric test. Values for two-way overlap comparisons based on total overlap between the datasets, not only the number indicated in the Venn Diagram, which does not include the 67 proteins overlapping between all three datasets. l. Table of information on selected proteins transferred from neurons to microglia and also present in aged aggregates and/or display an increased half-life with age. Y = yes, n = no.

References

    1. López-Otín C., Blasco M. A., Partridge L., Serrano M. & Kroemer G. The Hallmarks of Aging. Cell 153, 1194–1217 (2013). - PMC - PubMed
    1. Hetz C. Adapting the proteostasis capacity to sustain brain healthspan. Cell 184, 1545–1560 (2021). - PubMed
    1. Yang A. C. et al. Multiple Click-Selective tRNA Synthetases Expand Mammalian Cell-Specific Proteomics. J Am Chem Soc 140, 7046–7051 (2018). - PMC - PubMed
    1. Hipp M. S., Kasturi P. & Hartl F. U. The proteostasis network and its decline in ageing. Nat Rev Mol Cell Biol 20, 421–435 (2019). - PubMed
    1. Ribeiro F. C. et al. Synaptic proteasome is inhibited in Alzheimer’s disease models and associates with memory impairment in mice. Commun Biol 6, 1–12 (2023). - PMC - PubMed

Methods References

    1. Isolation of mouse brain-infiltrating leukocytes for single cell profiling of epitopes and transcriptomes. https://star-protocols.cell.com/protocols/652. - PMC - PubMed
    1. FEAST: A flow cytometry-based toolkit for interrogating microglial engulfment of synaptic and myelin proteins ∣ Nature Communications. https://www.nature.com/articles/s41467-023-41448-7. - PMC - PubMed
    1. Radhiyanti P. T., Konno A., Matsuzaki Y. & Hirai H. Comparative study of neuron-specific promoters in mouse brain transduced by intravenously administered AAV-PHP.eB. Neurosci Lett 756, 135956 (2021). - PubMed
    1. Yang A. C. et al. Multiple Click-Selective tRNA Synthetases Expand Mammalian Cell-Specific Proteomics. J Am Chem Soc 140, 7046–7051 (2018). - PMC - PubMed
    1. Diner I., Nguyen T. & Seyfried N. T. Enrichment of Detergent-insoluble Protein Aggregates from Human Postmortem Brain. J Vis Exp 55835 (2017) doi: 10.3791/55835. - DOI - PMC - PubMed

Publication types

LinkOut - more resources