[Preprint]. 2025 May 21:2025.05.20.654948.
doi: 10.1101/2025.05.20.654948.

A Universal 6iL/E4 Culture System for Deriving and Maintaining Embryonic Stem Cells Across Mammalian Species

Affiliations

A Universal 6iL/E4 Culture System for Deriving and Maintaining Embryonic Stem Cells Across Mammalian Species

Duo Wang et al. bioRxiv. .

Abstract

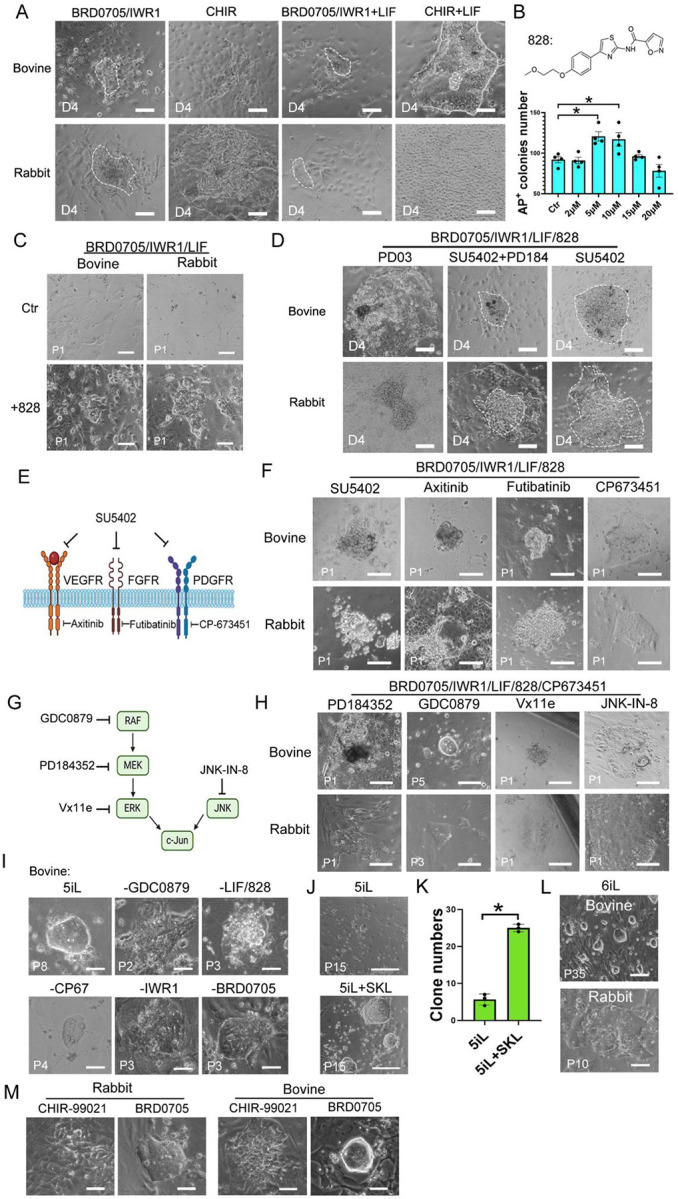
The derivation of authentic embryonic stem cells (ESCs) from diverse mammalian species offers valuable opportunities for advancing regenerative medicine, studying developmental biology, and enabling species conservation. Here, we report the development of a robust, serum-free culture system, termed 6iL/E4 that enables the derivation and long-term self-renewal of ESCs from multiple mammalian species, including mouse, rat, bovine, rabbit, and human. Using systematic signaling pathway analysis, we identified key regulators-including GSK3α, STAT3, PDGFR, BRAF, and LATS-critical for ESC maintenance across species. Additionally, inducible expression of KLF2 and NANOG enhances the naive pluripotency and chimeric potential of bovine ESCs. The E4 medium also supports stable ESC growth while minimizing lineage bias. These findings reveal conserved principles underlying ESC self-renewal across divergent mammalian species and provide a universal platform for cross-species stem cell research, disease modeling, and biotechnology applications.

Keywords: 6iL/E4 culture; GSK3α; PDGFR signaling; bovine ESCs; chimerism; embryonic stem cells; naive pluripotency; pluripotent stem cells; rabbit ESCs; species conservation.


Conflict of interest statement

DECLARATION OF INTERESTS Y.E.C., X.X., and J.X. are equity holders of ATGC Inc. Three provisional patents related to this study have been filed (APPLICATION # 63/798,735; APPLICATION # 63/798,645; APPLICATION # 63/748,241).

Figures

Figure 1.
Figure 1.. Optimization and Evaluation of Culture Conditions for Deriving and Expanding ESCs from bovine and rabbit
(A) Representative phase-contrast images of bovine and rabbit ICMs cultured under different conditions on day 4. Scale bars, 100 μm. Dashed outlines indicate undifferentiated ICM outgrowths. (B) Chemical structure of compound 828 and quantification of AP+ colonies in mESC cultures treated with 20 ng/ml LIF and varying concentrations of 828. Data are presented as mean ± SEM, with statistical significance indicated (*P < 0.05). (C) Representative Passage 1 (P1) cell morphologies from bovine and rabbit ICMs cultured under BRD0705/IWR1/LIF with or without 828. Scale bars, 100 μm. (D) Representative outgrowth morphology from bovine and rabbit ICMs cultured for 4 days under BRD0705/IWR1/LIF/828 conditions with specific signaling pathway inhibitors. Scale bars, 100 μm. Dashed outlines indicate undifferentiated ICM outgrowths. (E) Schematic illustration of the targets of SU5402. (F) Representative cell morphology of P1 ESCs derived from bovine and rabbit embryos and cultured with SU5402, Axitinib, Futibatinib, or CP-673451 in BRD0705/IWR1/LIF/828 E4 medium. Scale bar, 100 μm. (G) Diagram of the MAPK signaling cascade with small-molecule inhibitors used in this study: GDC0879 (RAF), PD184352 (MEK), Vx11e (ERK), and JNK-IN-8 (JNK). (H) Phase-contrast images showing the effects of MAPK pathway inhibitors on bESCs and rabESC derivation. ESCs were cultured in E4 medium supplemented with BRD0705, IWR1, LIF, 828, and CP67, with individual MAPK pathway inhibitors added separately. Scale bar, 100 μm. (I) Representative images of bESCs derived from bovine blastocysts and cultured in 5iL E4 medium, with or without the omission of individual components. Scale bars, 50 μm. (J) Phase-contrast images of bovine ESCs cultured under 6iL conditions, consisting of 5iL medium supplemented with the additional small molecule SKL. Scale bars, 200 μm. (K) Quantification of bESC colony numbers under ‘5iL’ medium with or without small molecules compound SKL. Data are presented as mean ± SEM. * p < 0.05. (L) Phase-contrast images of P35 bovine ESCs derived from blastocysts and P10 rabESCs derived from morula stage embryos in ‘6iL’ E4 medium. Scale bars = 100 μm. (M) Phase-contrast images of bESCs and rabESCs derived in 5iL plus CHIR or BRD0705. Scale bars = 50 μm.
Figure 2.
Figure 2.. Characterization of mESCs and rESCs derived and maintained in 6iL
(A) Top: Representative phase-contrast images showing ESCs cultured under 6iL conditions. Scale bars = 100 μm. Bottom: AP staining of ESC colonies derived under 6iL conditions. Scale bars = 50 μm. (B) Representative IF images of 6iL-derived ESCs (passage 15). Green indicates NANOG; red indicates OCT4; blue indicates HOECHST. Scale bars = 100 μm. (C) Representative IF images of EB outgrowths for multi-lineage differentiation markers. Scale bars = 200 μm. (D) Representative FL images of E9.5 days chimaeras from blastocyst injected with GFP labeled 6iL-mESCs. Scale bars = 500 μm. (E) Representative FL images of GFP+ cells cultured from dissociated E9.5 chimeric embryos. Scale bars = 100 μm. (F) Representative phase-contrast and FL images of GFP+ clones derived from the gonads of E13.5 chimeric embryos (chimaeras from blastocyst injected with GFP labeled 6iL-mESC) cultured in 2iL. Scale bars = 200 μm. (G) Representative phase-contrast and FL images of passage 3 EGCs derived from the GFP+ mono-clone shown in Figure (F), cultured under 2i/LIF conditions. Scale bars, 200 μm. (H) IF results confirming OCT4(red) expression in the GFP+ EGCs in Figure (G). Blue is Hoechst. Scale bars = 50 μm. (I) Representative IF analysis of rESCs cultured in 6iL, showing expression of pluripotency markers NANOG (red) and OCT4 (green). HOECHST (blue) marks nuclei. Scale bars = 50 μm. (J) Representative images of rESCs cultured in 6iL for six passages, and of 6iL-rESCs following transition to 2i conditions for two additional passages. Scale bars = 100 μm. (K) IF analysis of EB outgrowths derived from 6iL-cultured rESCs, showing expression of lineage-specific markers: TUJ1 (ectoderm), FOXA2 (endoderm), and MF-20 (mesoderm). Nuclei are counterstained with HOECHST (blue). Scale bars = 100 μm. (L) IF analysis of PGC-LCs differentiated from 6iL-rESCs, showing expression of PGC-specific markers NANOS3 (green) and TFAP2C (red). Nuclei are counterstained with HOECHST (blue). Scale bars = 20 μm. (M) qRT-PCR analysis of PGC marker gene expression of PGC-LCs derived from 6iL-cultured rESCs. Data are presented as mean ± SEM. *p< 0.05, **p < 0.01.
Figure 3.
Figure 3.. Derivation and Characterization of 6iL-bESCs
(A) Representative images of bovine blastocyst, outgrowths and ESC colonies (passage 1 and 35) derived under the ‘6iL’ condition. Scale bars = 100 μm. (B) IF staining of 6iL-bESCs showing NANOG and OCT4 expression. Scale bars = 50 μm. (C) qRT-PCR comparing pluripotency markers (Nanog, Pou5f1, Sox2, Rex1) and formative marker Otx2 in 6iL-bESCs versus AFX-cultured cells. (mean ± SEM; p< 0.05, ns, not significant). (D) Representative IF images of EB outgrowths demonstrating mesoderm (MF-20), ectoderm (TUJ1), and endoderm (GATA4) differentiation. Scale = 50 μm. (E) Representative Images of GFP-labeled 6iL-bESCs with a DOX-inducible Klf2/Nanog system. Scale bars = 100 μm. The right panel shows the qRT-PCR results demonstrating the expression of exogenous Klf2 and Nanog genes after the addition of DOX. (F) AP staining of i-Klf2/Nanog-expressing bovine ESCs ± DOX under 6iL conditions with corresponding quantification. Scale = 200 μm. (G) qRT-PCR analysis of pluripotency gene expression in 6iL-bESCs ± DOX. (H) IF images of PGC-LC cells derived from 6iL-bESCs showing PRDM1 (green) and NANOS3 (red). Scale bars= 50 μm. (I) qRT-PCR of PGC marker genes during differentiation of 6iL-bESCs into PGC-LCs (mean ± SEM; p < 0.05, *p < 0.01). (J) Representative images of morula- and blastocyst-stage bovine embryos injected with DOX-inducible GFP-labeled 6iL-bESCs. Scale bars= 100 μm. (K) IF analysis of bovine embryo sections from day 40 chimeras, which were developed from blastocyst embryos injected with DOX-inducible Klf2/Nanog-expressing GFP-labeled bESCs. Scale bars, 100 μm. Insets show enlarged images. Scale bars, 500 μm.
Figure 4.
Figure 4.. Derivation and Characterization of rabESCs in 6iL/TDI
(A) Representative phase-contrast images of rabESCs derived from morula-stage embryos in 6iL, 6iL+TRULI, or 6iL+TDI in E4 medium at P12. Scale bars = 100 μm. (B) Representative phase-contrast images of bESCs cultured under ‘5iL’ conditions with additional small molecules (TRULI, TDI, and SKL). Scale bars = 200 μm (C) Quantification of bESC colony numbers under ‘6iL’ conditions with additional small molecules. Data are presented as mean ± SEM. * p < 0.05, ** p < 0.01. (D) Summary table showing the efficiency of rabESC derivation from different developmental stages. (E) Schematic representation of rabESC derivation from individual morula embryos under 6iL conditions. (F) Representative phase-contrast images showing the morphology of rabESCs derived from the morula stage. Scale bars = 100 μm. (G) Representative IF images of 6iL-TDI-derived rabESCs showing robust expression of pluripotency markers NANOG (red) and OCT4 (green). Scale bars = 50 μm. (H) Representative IF images of EBs differentiation derived from 6iL rabESCs, confirming expression of lineage-specific markers: TUJ1 (ectoderm, red), FOXA2 (endoderm, red), and HOECHST (blue). Scale bars = 100 μm. (I) Karyotype analysis of passage 10 (P10) rabESCs, showing a normal diploid chromosome number (2n=44). (J) Representative phase-contrast and FL images showing GFP-labeled rabESC colonies derived under 6iL conditions. Scale bars = 100 μm. (K) Schematic of generating chimeric rabbit embryos by transferring GFP-labeled rabESCs into 8-cell embryos that develop into blastocysts in vitro. (L) Microinjection of GFP-labeled 6iL ESCs into 8-cell stage rabbit embryos. (M) Representative FL images showing the contribution of GFP+ rabESCs to rabbit chimeric embryos. Ten GFP-labeled rabESCs were injected into each 8-cell stage rabbit embryos, and fluorescence images show successful integration into blastocysts. Scale bars: 100 μm.
Figure 5.
Figure 5.. Generation and Characterization of Human PSCs using 6iL
(A) Schematic of the reprogramming strategy for generating hiPSCs. (B) Representative phase-contrast image of a hiPSC clone derived from human cord blood cells at day 12 of reprogramming. Scale bar = 200 μm. (C) Representative images of hiPSC cultured under the 6iL condition at passage 25. Scale bar = 100 μm. (D) IF analysis confirming expression of the naive pluripotency markers NANOG and OCT4 in 6iL-hiPSCs. HOECHST (blue) marks nuclei. Scale bars = 50 μm. (E) Representative IF images of EB outgrowths derived from 6iL-hiPSCs, showing expression of lineage-specific markers: TUJ1 (ectoderm, green), FOXA2 (endoderm, red), and cTNT (mesoderm, red). Scale bars = 200 μm. (F) A PCA plot of RNA-seq data from 6iL-hiPSC and hESC cell lines established under different representative hESC culture conditions. (G) IF analysis of PGC-LCs differentiated from 6iL-hiPSCs, showing expression of PGC-specific proteins TFAP2C (red), PRDM1 (green), and HOECHST (blue) marks nuclei. Scale bars = 50 μm. (H) qRT-PCR analysis of PGC marker gene expression on days 0 and 3 of PGC-LCs differentiated from 6iL-hiPSCs. Data are presented as mean ± SEM. *p < 0.05, **p < 0.01. (I) Cell morphology of hiPSCs cultured under 6iL conditions; their morphology after transitioning to mTeSR conditions; and the morphology of cells cultured for 7 passages in mTeSR conditions and subsequently reverted to 6iL+Go/feeder conditions. Scale bars = 200 μm. (J) qRT-PCR analysis comparing the expression of pluripotency marker genes in hiPSCs cultured under 6iL conditions, cells transitioned to mTeSR conditions, and the 6269 hiPSC cell line cultured in mTeSR conditions. Data are presented as mean ± SEM. *p < 0.05, **p <0.01, ***p<0.001. (K) Schematic of the ΔPE-Oct4-GFP reset system in WIBR3 hESCs. Cells were transfected with ΔPE-Oct4-GFP and subjected to a DOX-inducible Klf2/Nanog system to induce a naive state. After DOX withdrawal, cells were cultured under 6iL or t2iL Go conditions. (L) Representative FL images of ΔPE-Oct4-GFP+ WIBR3 hESCs with a DOX-inducible Klf2/Nanog system. After DOX withdrawal, the cell morphology was observed under 6iL and t2iL Go conditions at passages 1, 3, and 8. Scale bars = 100 μm.

References

    1. Evans M.J., and Kaufman M.H. (1981). Establishment in culture of pluripotential cells from mouse embryos. Nature 292, 154–156. 10.1038/292154a0. - DOI - PubMed
    1. Martin G.R. (1981). Isolation of a pluripotent cell line from early mouse embryos cultured in medium conditioned by teratocarcinoma stem cells. Proceedings of the National Academy of Sciences of the United States of America 78, 7634–7638. 10.1073/pnas.78.12.7634. - DOI - PMC - PubMed
    1. Buehr M., Meek S., Blair K., Yang J., Ure J., Silva J., McLay R., Hall J., Ying Q.L., and Smith A. (2008). Capture of authentic embryonic stem cells from rat blastocysts. Cell 135, 1287–1298. 10.1016/j.cell.2008.12.007. - DOI - PubMed
    1. Li P., Tong C., Mehrian-Shai R., Jia L., Wu N., Yan Y., Maxson R.E., Schulze E.N., Song H., Hsieh C.L., et al. (2008). Germline competent embryonic stem cells derived from rat blastocysts. Cell 135, 1299–1310. 10.1016/j.cell.2008.12.006. - DOI - PMC - PubMed
    1. Smith A.G., Heath J.K., Donaldson D.D., Wong G.G., Moreau J., Stahl M., and Rogers D. (1988). Inhibition of pluripotential embryonic stem cell differentiation by purified polypeptides. Nature 336, 688–690. 10.1038/336688a0. - DOI - PubMed

Publication types