

Healthy life expectancy by county, race, and ethnicity in the USA, 2009-19: a systematic analysis of health disparities
- PMID: 40475811
- PMCID: PMC12137174
- DOI: 10.1016/j.lana.2025.101064
Healthy life expectancy by county, race, and ethnicity in the USA, 2009-19: a systematic analysis of health disparities
Abstract
Background: There are substantial disparities in longevity in the USA; however, differences in healthy life expectancy (HALE) remain incompletely understood. We aimed to examine trends and disparities in HALE by race and ethnicity for 3 110 US counties.
Methods: We used data from the American Community Survey (2009-19, N = 23.9 m-30.5 m, across indicators), Behavioral Risk Factor Surveillance System (2011-19, N = 1.7 m-3.9 m), Gallup Daily Survey (2009-16, N = 1.8 m-1.9 m); sociodemographic covariates; and disease-specific mortality rates in small-area estimation models to estimate Years Lived with Disability (YLDs) by county, race and ethnicity (American Indian or Alaska Native [AIAN], Asian or Pacific Islander [Asian], Black, Latino or Hispanic [Latino], and White), sex, age, and year (2009-19). We derived HALE using these YLD rates to discount life expectancy.
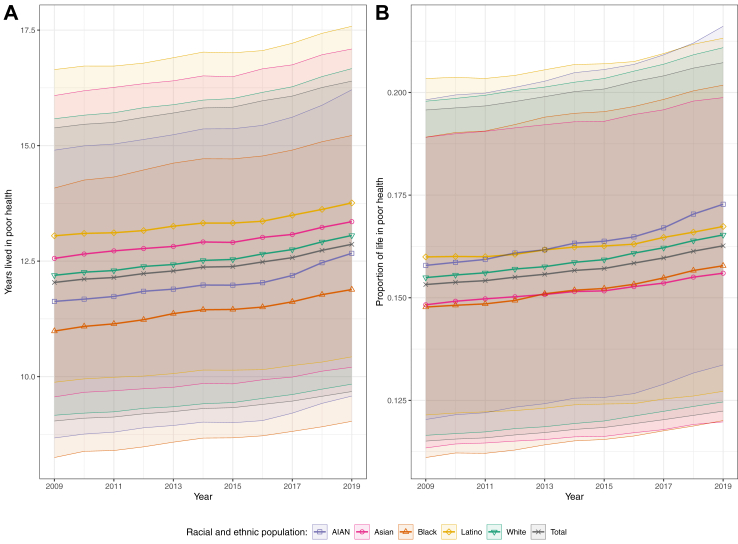
Findings: From 2009 to 2019, HALE declined nationally by 0.3 years (95% uncertainty interval: 0.1-0.5) to 66.2 (62.7-69.4), while life expectancy increased by 0.5 years (0.5-0.5) to 79.1 (79.1-79.1). The Asian population had the highest HALE (72.3 [68.5-75.5] in 2019), followed by the Latino (68.5 [64.7-71.8]), White (65.9 [62.3-69.1]), Black (63.4 [60.1-66.3]), and AIAN populations (60.7 [57.0-64.1]). The Latino population had the longest absolute duration in poor health (13.8 years [10.4-17.6] in 2019) whereas the AIAN population had the longest proportion of life in poor health (17.3% [13.0-22.2]). From 2009 to 2019, HALE declined for the AIAN (by 1.4 years [1.0-1.8]) and White (by 0.6 years [0.4-0.8]) populations and the proportion of life in poor health increased for all populations. At the county level, HALE declined in 91.3% of counties (2 812 of 3 079; 65.6% statistically significant) from 2000 to 2019 and ranged from 55.1 to 76.2 years in 2019. Racial and ethnic disparities at the county level were broadly similar to national patterns, but with some exceptions.
Interpretation: Disparities in HALE in the USA are large, and HALE has worsened for many populations in recent years. The expanding duration and proportion of life spent in poor health could indicate an increasing need for health services.
Funding: Intramural Research Program, National Institute on Minority Health and Health Disparities, US National Institutes of Health (contract #75N94023C00004). Intramural Research Program, National Institute on Minority Health and Health Disparities; National Heart, Lung, and Blood Institute; Intramural Research Program, National Cancer Institute; National Institute on Aging; National Institute of Arthritis and Musculoskeletal and Skin Diseases; Office of Disease Prevention; and Office of Behavioral and Social Sciences Research, US National Institutes of Health (contract #75N94019C00016).
Keywords: BRFSS; HALE; Health disparities; Healthy life expectancy; Place based health disparities; Racial and ethnic health disparities; USA.
© 2025 The Author(s).
Conflict of interest statement
We declare no competing interests.
Figures


References
Grants and funding
LinkOut - more resources
Full Text Sources
