. 2025 May 22:13:1578180.
doi: 10.3389/fcell.2025.1578180. eCollection 2025.

snRNA-seq reveals subcutaneous white adipose tissue remodeling upon return to thermoneutrality after cold stimulation

Affiliations

snRNA-seq reveals subcutaneous white adipose tissue remodeling upon return to thermoneutrality after cold stimulation

Yusha Yang et al. Front Cell Dev Biol. .

Abstract

Introduction: Cold stimulation induces browning of subcutaneous white adipose tissue (sWAT), making it a prime target for treating obesity and metabolic disorders. However, this remodeling is reversible: upon return to thermoneutrality (rewarming), sWAT whitens and loses its enhanced metabolic functions. Given the limited understanding of the microscopic dynamic changes and underlying mechanisms during this process, we established a temporally dynamic mouse model spanning the entire period from cold stimulation to the return to thermoneutrality, with inguinal sWAT (iWAT) selected as the study subject.

Methods: Based on preliminary data demonstrating stabilization in iWAT histology, expression levels of key thermogenic proteins, and the bulk transcriptome, we selected the two-week time point after the return to thermoneutrality for detailed analysis. Subsequently, we employed single-nucleus RNA sequencing (snRNA-seq) to comprehensively characterize iWAT cellular dynamics during cold stimulation and the subsequent two-week period after the return to thermoneutrality.

Results: Our findings revealed that while iWAT phenotypically reverts to a white state after 2 weeks of rewarming, as evidenced by structural, functional, and bulk transcriptomic characteristics, significant cold-induced molecular and cellular signatures persist. Specifically, we observed altered differentiation trajectories in both adipose stem and progenitor cells (ASPCs) and adipocytes, suggesting dedifferentiation and reprogramming tendencies. Furthermore, the ANGPTL signaling pathway, activated in thermogenic adipocyte subpopulation A3 during cold stimulation, remained active and influenced cell-cell communication even after the loss of thermogenic capacity.

Discussion: hese findings provide novel insights into elucidating the complex cellular and molecular mechanisms underlying the temperature-dependent plasticity of iWAT, and suggest that the ANGPTL signaling pathway may play a potential role in maintaining the white phenotype of iWAT after withdrawal from cold stimulation.

Keywords: cold stimulation; plasticity; single-nucleus RNA sequencing; subcutaneous white adipose tissue; thermoneutrality.


Conflict of interest statement

The authors declare that the research was conducted in the absence of any commercial or financial relationships that could be construed as a potential conflict of interest.

Figures

FIGURE 1
FIGURE 1
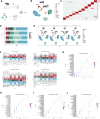
iWAT Achieves Stable Remodeling After Dynamic Changes Upon Return to Thermoneutrality Following Cold Stimulation (A) A mouse model of cold stimulation followed by a return to thermoneutrality was established. Eight-week-old male C57BL/6J mice were initially housed at 30°C for 10 days (T0/TN) followed by cold stimulation at 4°C for 2 weeks (T1/CE), and subsequently returned to 30°C for 3 days (T2/RTN3d), 1 week (T3/RTN1w), 2 weeks (T4/RTN2w), 4 weeks (T5/RTN4w), or 6 weeks (T6/RTN6w). iWAT was collected at each time point (T0-T6) for analysis. (B) Gross morphology of iWAT from mice at T0-T6. (C) HE stains of iWAT sections from mice at T0-T6 (n = 21). Scale bar, 100 μm. (D) IF staining of iWAT sections for perilipin 1 (PLIN1) and uncoupling protein 1 (UCP1) in mice at T0-T6. Scale bar, 100 μm. (n = 3 per group). (E) Summary of differentially expressed genes (DEGs) identified by bulk RNA sequencing analysis of iWAT (n = 21). (F) Heatmap showing the expression of all DEGs in iWAT at T0-T6.
FIGURE 2
FIGURE 2
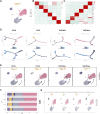
SnRNA-seq Reveals Dynamic Remodeling of Cell Composition and Gene Expression Profiles in iWAT Upon Return to Thermoneutrality After Cold Stimulation (A) Schematic overview of the snRNA-seq experimental workflow. Nuclei are isolated from the iWAT of mice at T0, T1, T2, and T4. Sequencing is performed using the 10x Genomics platform, followed by bioinformatic analysis. (B) UMAP of cells (n = 97,666) identified in iWAT across the four time points. Cell clusters include adipocytes, B lymphocytes (BCs), T lymphocytes (TCs), M1 macrophages (M1), M2 macrophages (M2), dendritic cells (DCs), adipose stem and progenitor cells (ASPCs), pericytes, endothelial cells (ECs), smooth muscle cells (SMCs), proliferation-related immune cells (Prolif), and an unknown cell type. (C) Heatmap showing the scaled average expression of highly variable genes and canonical markers across iWAT cell clusters. (D,E) Percent bar graphs and UMAPs showing the changes in the composition of the 11 cell types in iWAT under T0, T1, T2, and T4. (F) Volcano plots showing upregulated and downregulated genes in 11 clusters in the comparison group (ident.1) relative to the control group (ident.2). Upregulated genes (average logFC >0 and adjusted p-value <0.05) are shown in red, while downregulated genes (average logFC <0 and adjusted p-value <0.05) are shown in blue. (G–J) KEGG pathway enrichment analysis of upregulated genes in each cluster in the comparison group (ident.1) relative to the control group (ident.2). The top 10 pathways are shown for comparison.
FIGURE 3
FIGURE 3
Shifting Subpopulation Differentiation Trajectories of ASPCs in iWAT Upon Return to Thermoneutrality After Cold Stimulation. (A) UMAP of subpopulations (S1-S6) identified within the ASPCs population following re-clustering. (B) Heatmap showing the average scaled gene module scores for the top 50 most significant genes within each ASPCs subcluster (S1-S6). (C) Heatmap showing the scaled average expression of highly variable genes and canonical markers across ASPC subclusters (S1-S6). (D) The trajectory inference of ASPCs subpopulations (S1-S6) across the T0, T1, T2, and T4. (E) The RNA velocity of ASPCs subpopulations (S1-S6) across the T0, T1, T2, and T4. (F,G) Percent bar graphs and UMAPs showing the changes in the composition of ASPC subpopulations (S1-S6) under T0, T1, T2, and T4.
FIGURE 4
FIGURE 4
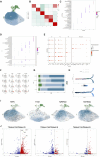
Reprogramming of Adipocyte Subpopulations in iWAT Upon Return to Thermoneutrality After Cold Stimulation. (A) UMAP of subclusters (A1-A6) identified within the adipocytes following re-clustering. (B) Heatmap showing the average scaled gene module scores for the top 50 most significant genes within each adipocyte subpopulation (A1-A6). (C) KEGG pathway and (D) GO enrichment analyses of differentially expressed genes across adipocyte subpopulation (A1-A6). The top 10 enriched pathways/terms are shown for comparison. (E) Bubble plot showing the expression of characteristic marker genes within adipocyte subpopulations (A1-A6). (F) Feature plots showing the expression of browning markers Ucp1, Ppargc1α, Ppargc1β, and Cidea in subcluster A3 across the T0, T1, T2, and T4. (G) Percent bar graph showing the changes in the composition of adipocyte subpopulatins (A1-A6) under T0, T1, T2, and T4. (H) Trajectory inference between ASPC subpopulations and adipocyte subpopulations. (I) RNA velocity analysis of adipocyte subclusters (A1-A6) across the T0, T1, T2, and T4. (J) Volcano plots showing the expression of DNL-related genes (Acly, Acaca, Fasn, Elovl6, and Scd1) in subcluster A3 at T1, T2, and T4 relative to T0. Upregulated genes (average logFC >0 and adjusted p-value <0.05) are shown in red, while downregulated genes (average logFC <0 and adjusted p-value <0.05) are shown in blue.
FIGURE 5
FIGURE 5
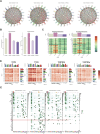
Dynamic Intercellular Communication Networks in iWAT Undergo Remodeling Upon Return to Thermoneutrality After Cold Stimulation. (A) Circle plots showing intercellular communication networks within iWAT at T0, T1, T2, and T4. (B) Bar graph showing the number and strength of intercellular communication interactions at T0, T1, T2, and T4. (C) Heatmap showing the number of outgoing/incoming signals for each cell type in iWAT at T0, T1, T2, and T4. The bar graph represents the sum of each column. (D) Heatmap showing the total number of potential ligand-receptor pairs identified by Cell Chat between different cell types in iWAT at T0, T1, T2, and T4. The bar graph represents the sum of each column or row. (E) Overall signaling patterns within iWAT, represented as the upregulated information flow in different cell types at T0, T1, T2, and T4.
FIGURE 6
FIGURE 6
Ligand-receptor pairs mediated by the A3 subset upon cold stimulation and return to thermoneutrality for 2 weeks. (A,B) Upregulated ligand-receptor pairs between adipocyte subcluster A3 and other adipocyte subclusters, ASPC subclusters, immune cells, and angiogenesis-related cells at T0, T1, T2, and T4.

Similar articles

References

    1. Barbatelli G., Murano I., Madsen L., Hao Q., Jimenez M., Kristiansen K., et al. (2010). The emergence of cold-induced brown adipocytes in mouse white fat depots is determined predominantly by white to brown adipocyte transdifferentiation. Am. J. Physiol. Endocrinol. Metab. 298 (6), E1244–E1253. 10.1152/ajpendo.00600.2009 - DOI - PubMed
    1. Bartelt A., Heeren J. (2014). Adipose tissue browning and metabolic health. Nat. Rev. Endocrinol. 10 (1), 24–36. 10.1038/nrendo.2013.204 - DOI - PubMed
    1. Bergen V., Lange M., Peidli S., Wolf F. A., Theis F. J. (2020). Generalizing RNA velocity to transient cell states through dynamical modeling. Nat. Biotechnol. 38 (12), 1408–1414. 10.1038/s41587-020-0591-3 - DOI - PubMed
    1. Berry D. C., Jiang Y., Graff J. M. (2016). Mouse strains to study cold-inducible beige progenitors and beige adipocyte formation and function. Nat. Commun. 7, 10184. 10.1038/ncomms10184 - DOI - PMC - PubMed
    1. Burl R. B., Ramseyer V. D., Rondini E. A., Pique-Regi R., Lee Y. H., Granneman J. G. (2018). Deconstructing adipogenesis induced by beta3-adrenergic receptor activation with single-cell expression profiling. Cell Metab. 28 (2), 300–309 e304. 10.1016/j.cmet.2018.05.025 - DOI - PMC - PubMed

LinkOut - more resources