. 2025 Dec;14(1):2515461.
doi: 10.1080/22221751.2025.2515461. Epub 2025 Jun 19.

Origin of Neisseria meningitidis clonal complex 4821

Affiliations

Origin of Neisseria meningitidis clonal complex 4821

Zhizhou Tan et al. Emerg Microbes Infect. 2025 Dec.

Abstract

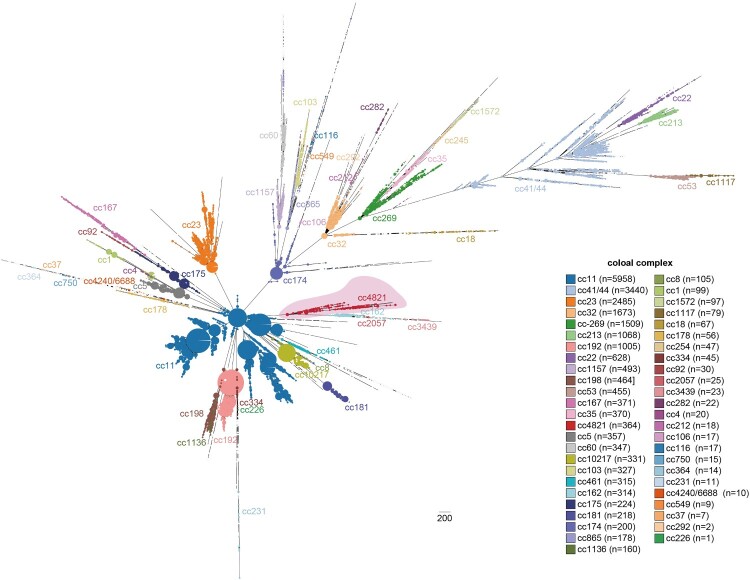
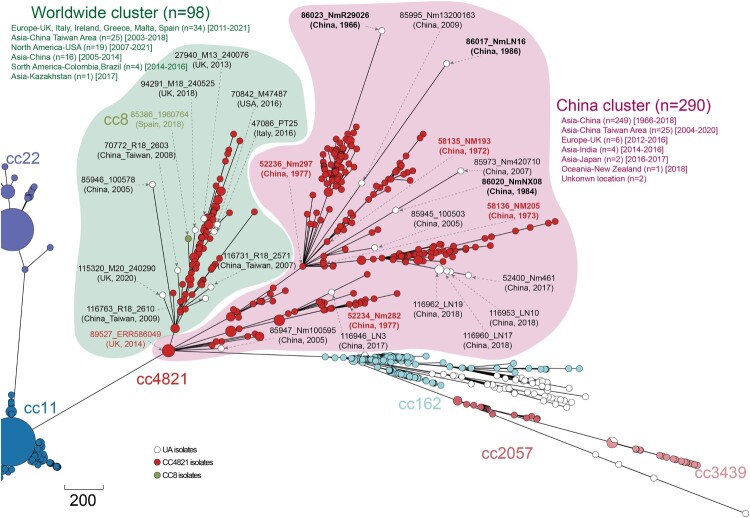
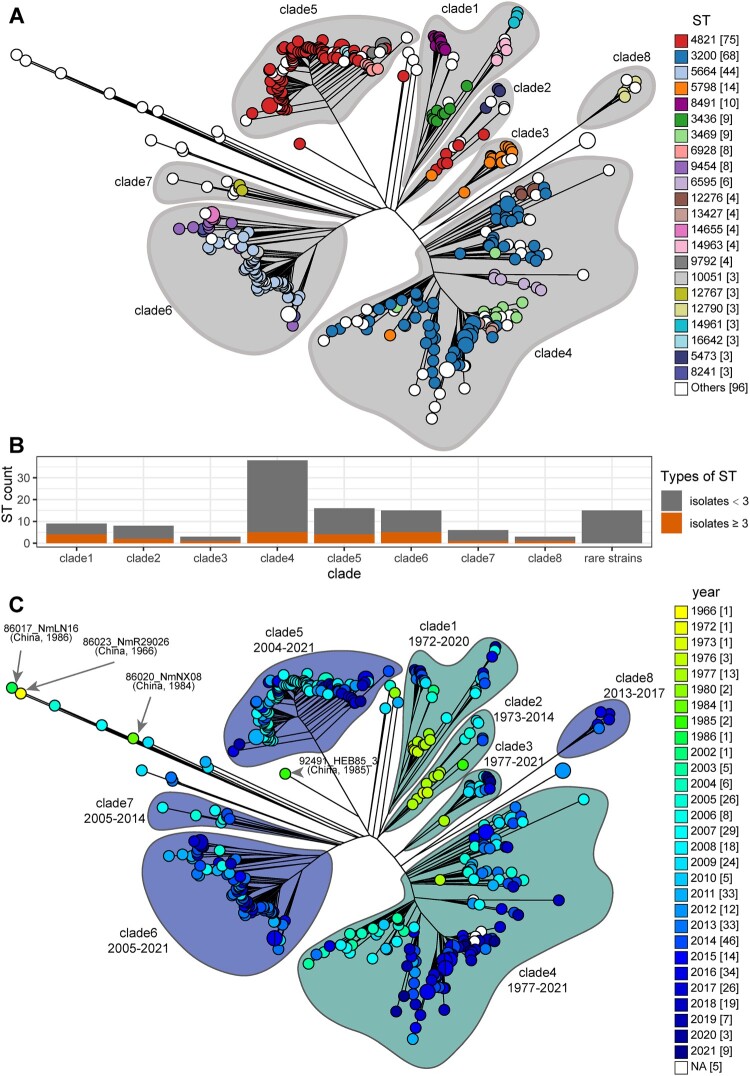
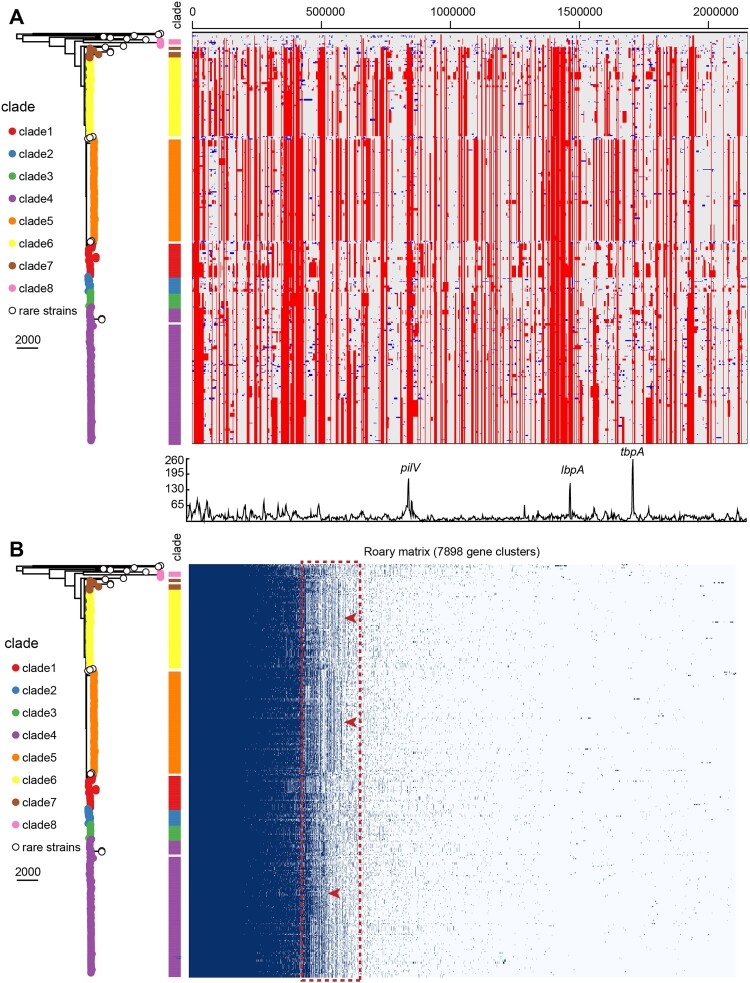
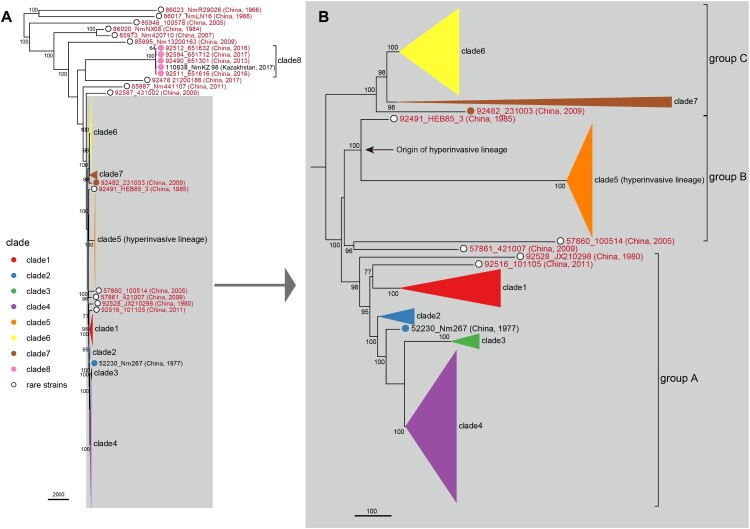
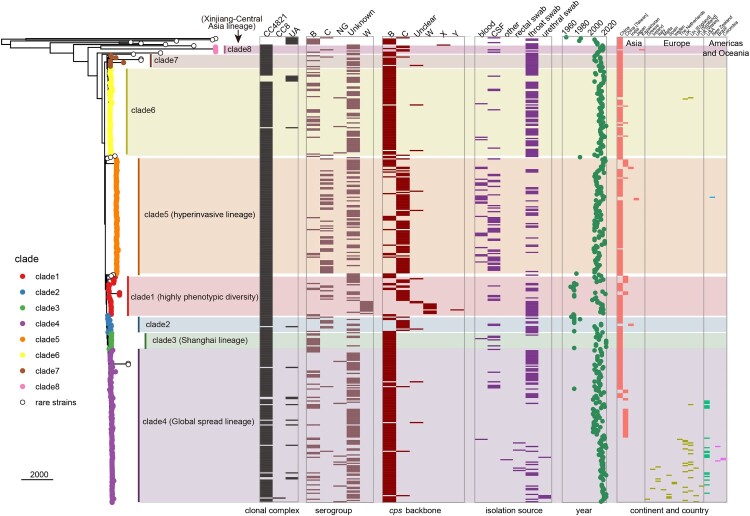
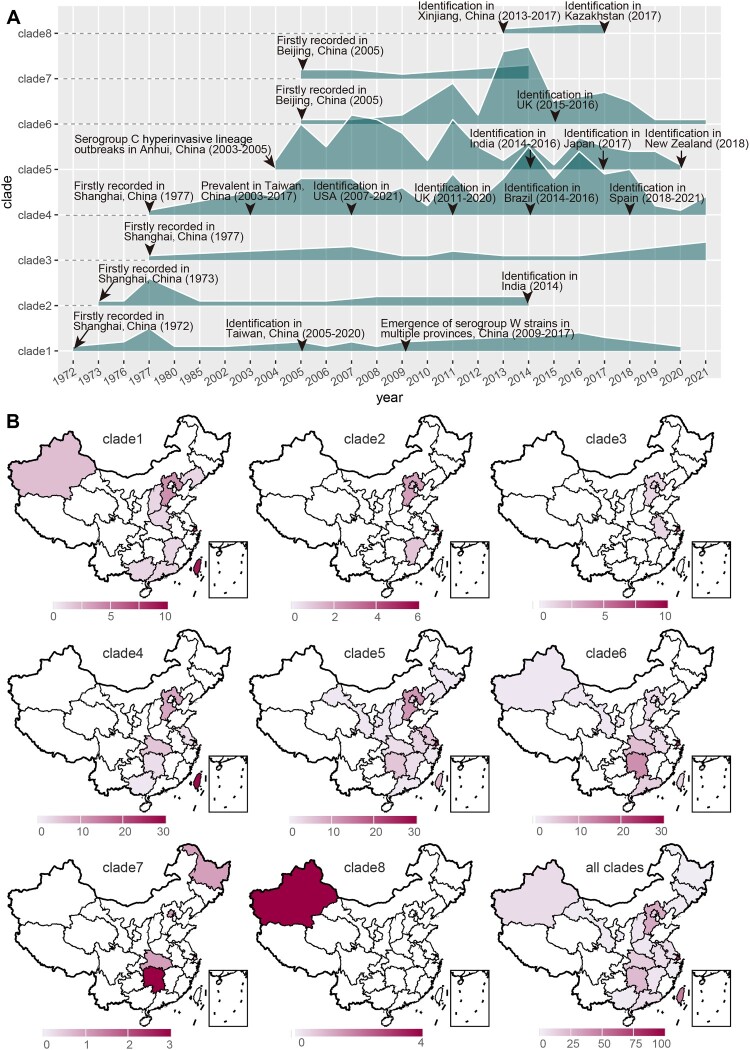
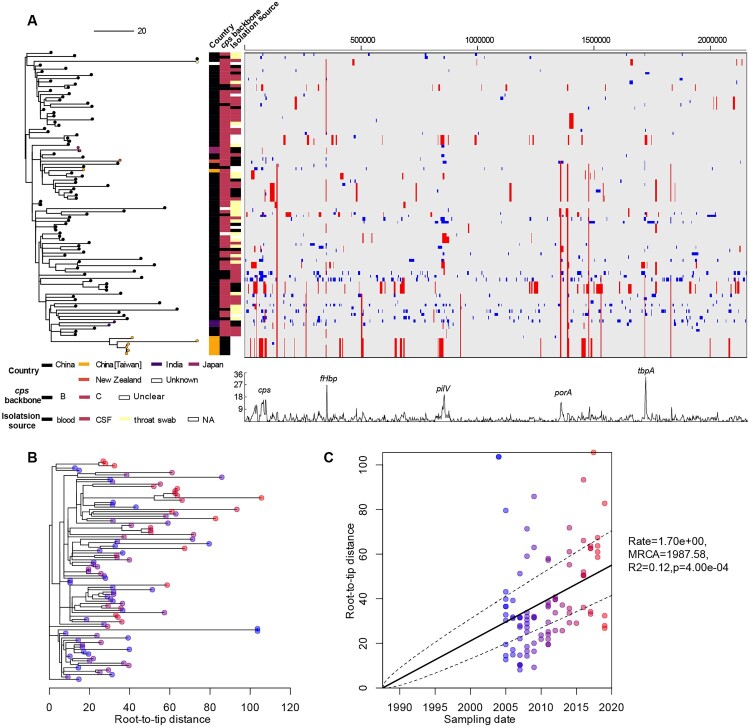
Neisseria meningitidis (N. meningitidis) is the causative agent of human invasive meningococcal disease (IMD). Clonal complex (CC) 4821 is a unique genetic cluster of N. meningitidis that emerged two decades ago in Anhui Province, China and became the predominant cluster. However, the evolutionary origin of CC4821 remains unclear. Herein, a distinct CC4821 clade was identified by a comprehensive cgMLST analysis of 26,801 N. meningitidis genomes. The CC4821 clade comprised 388 N. meningitidis isolates, with 364 assigned to CC4821, 1 assigned to CC8, and 23 unassigned (UA), as they could not be assigned to any defined CC. The phylogenetic analysis of the CC4821 clade revealed that six UA isolates, including the UA isolate NmR29026 collected in 1966 from Liaoning Province, China, occupied a basal position compared to all isolates within the CC4821 clade, indicating that CC4821 originated in the 1960s. Eight subclades (clades 1-8) were recognized within the CC4821 clade. Clades 1-4 have been present since the 1970s, while clades 5-8 emerged after the 2000s. Clade 5 represents a hyperinvasive lineage. N. meningitidis isolate HEB85-3, collected in 1985 in Hebei Province, China, exhibited the closest evolutionary relationship to clade 5, suggesting it is related to the origin of this hyperinvasive lineage. Our study reveals that CC4821 has emerged as the predominant cluster of N. meningitidis in China, representing the culmination of at least 60 years of continuous evolution in China, and is not solely attributable to the outbreak two decades ago.

Keywords: Neisseria meningitidis; bacterial evolution; clonal complex 4821; hyperinvasive lineage; population structure.


Conflict of interest statement

No potential conflict of interest was reported by the author(s).

Figures

Figure 1.
Figure 1.
Minimum spanning tree of global Neisseria meningitidis. Allelic profiles of 28601 isolates were compared using GrapeTree, which led to the formation of clades consisting of isolates with similar allelic profiles. Branches with a length of less than five were collapsed in the tree. The tree was subsequently annotated with clonal complexes, with the corresponding number of isolates belonging to each clonal complex displayed in parentheses. The clonal complex 4821 clade is highlighted in the tree with a light red background.
Figure 2.
Figure 2.
Minimum spanning tree of the clonal complex 4821 clade. A subtree extracted from the minimum spanning tree of global Neisseria meningitidis. The clonal complex (CC) 4821 clade consisted of 364 isolates of CC4821, 1 isolate of CC8, and 23 unassigned (UA) isolates, which are coloured in red, olive, and white, respectively. The PubMLST ID and isolate name of all of the UA isolates in the tree were annotated, with the collection location and year displayed in parentheses. Within the CC4821 clade, there were two subclusters named the China cluster and Worldwide cluster. The summarized epidemiological information, including the collection location and year of isolates in each subcluster, were also provided.
Figure 3.
Figure 3.
Population structure within the CC4821 clade. (A) A neighbor-joining (NJ) tree was constructed based on cgMLST distances of 388 isolates from the CC4821 clade. Eight subclades (clades 1–8) were distinguished. Isolates that could not be grouped into any clades were referred to as rare strains. The tips of the tree were colour-coded according to the sequence type (ST) of each isolate, with the corresponding numbers of isolates belonging to each ST displayed in parentheses. Only STs with more than three isolates are shown. (B) The genetic diversity of the eight clades was assessed by quantifying the number of STs within each clade. The STs were classified as two types based on the number of isolates within each ST. Prevalent STs with more than three isolates are coloured orange, while rare STs with fewer than three isolates are coloured dark gray. (C) An identical NJ tree to that in panel A is presented. The tree tips were colour-coded based on the collection year of each isolate, with the corresponding number of isolates collected each year displayed in parentheses. An analysis of the sampling records revealed that clades 1–4 were present since the 1970s and are marked in dark green, whereas clades 5–8 originated after the 2000s and are marked in dark blue. The PubMLST ID and isolate names of three UA isolates and one CC4821 isolate in the tree were labelled alongside the collection location and year, shown in parentheses. The three historical UA isolates obtained between 1966 and 1986 were potentially linked to the origin of CC4821, while the CC4821 isolate HEB85-3, retrieved from Hebei Province, China, in 1985, showed the closest relationship with clade 5, indicating its possible connection to the origin of the hyperinvasive lineage within the CC4821 clade.
Figure 4.
Figure 4.
Phylogenetic reconstruction, recombination analysis, and pan-genome analysis of the CC4821 clade. (A) In the left panel, a maximum likelihood tree was generated using the nonrecombinant regions of a whole-genome alignment consisting of the 388 isolates from the CC4821 clade. The scale bar on the tree represents the number of point mutations observed along each branch. To differentiate the isolates based on their clade affiliation, the tip points on the tree were assigned colours. Isolates that could not be grouped into specific clades were referred to as rare strains and coloured white. The middle panel presents bar plots that illustrate the clade affiliation of each isolate. The right panel shows a recombination plot aligned with the isolates in the phylogenetic tree. Red bars indicate recombination events occurring on internal nodes in the tree which were subsequently inherited by multiple descendant isolates, while blue bars indicate recombination events occurring in only one isolate at the terminal node. In the lower half of the graph, the line represents the frequency of recombination events throughout the length of the genome, with genomic annotations based on the reference genome of N. meningitidis isolate 053442 (GenBank ID: NC_010120, PubMLST ID: 12672). Genes located in recombination hotspots, characterized by peaks in recombination event frequencies, were annotated. These recombination hotspots included transferrin-binding protein A (tbpA), type IV pilus modification protein (pilV), and lactoferrin binding protein A (lbpA). (B) In the left panel, an identical maximum likelihood tree to that in panel A is exhibited. The middle panel presents bar plots that illustrate the clade affiliation of each isolate. The right panel displays a matrix indicating the presence or absence of core and accessory genes within the CC4821 clade, generated using Roary software. A total of 7898 genes were identified within the CC4821 clade. Notably, distinct variations in the presence and absence of genes are highlighted by red arrows, specifically observed between clade 4, clade 5, and clade 6.
Figure 5.
Figure 5.
Phylogenetic tree of the CC4821 clade. (A) An identical maximum likelihood tree to that in Figure 4(A) is exhibited. To enhance the clarity of tree visualization, the tips representing clade 1–7 were collapsed and coloured based on their respective clade assignments. Each tip label includes the isolate's PubMLST ID and name, with the sampling location and collection year provided in parentheses. The tip labels of isolates collected and sequenced by us are highlighted in red. (B) A subtree of panel A is presented to clearly demonstrate the evolutionary relationships among clades 1–7 and rare strains.
Figure 6.
Figure 6.
Phenotypic and epidemiological characteristics of isolates within the CC4821 clade. An identical maximum likelihood tree to that of Figure 4(A) is exhibited. Eight subclades within the CC4821 clade were visually distinguished by different colours. The rectangles and scatter plot in the right panel of the tree present the epidemiological and phenotypical information of each isolate. This information included clonal complex, serogroup, capsule polysaccharide synthesis (cps) backbone, isolation source (associated with disease-causing potential), year of collection, and geographic origin (continent and country).
Figure 7.
Figure 7.
The temporal and geographical distribution patterns of clades within CC4821. (A) A ridgeline plot was used to visualize the temporal distribution information of each clade within CC4821, based on the collection year of the isolates. Notable transmission events associated with each clade were marked at their respective time points. (B) Geographical distribution of each clade within CC4821 in China at the provincial level.
Figure 8.
Figure 8.
Phylogenetic reconstruction, recombination analysis, and root-to-tip correlation analysis of the hyperinvasive lineage. (A) In the left panel, a maximum likelihood tree was generated using the nonrecombinant regions of a whole-genome alignment consisting of 96 isolates from the hyperinvasive lineage. The tips were coloured based on the country or regions of each isolate. The scale bar represents the number of point mutations along each branch. In the middle panel, bar plots display the country of origin, capsule polysaccharide synthesis (cps) backbone, and the source of isolation (associated with disease-causing potential) of each isolate. The right panel shows a recombination plot aligned with the isolates in the phylogenetic tree. Red bars indicate recombination events occurring on internal nodes in the tree that were subsequently inherited by multiple descendant isolates, while blue bars indicate recombination events occurring in only one isolate at the terminal node. In the lower half of the graph, the line represents the frequency of recombination events throughout the length of the genome, with genomic annotations based on the reference genome of N. meningitidis isolate 053442 (GenBank ID: NC_010120, PubMLST ID: 12672). Genes located in recombination hotspots, characterized by peaks in recombination event frequencies, were annotated. These recombination hotspots include transferrin-binding protein A (tbpA), factor H-binding protein (fHbp), type IV pilus modification protein (pilV), meningococcal outer membrane protein porin A (porA), and the cps locus. (B) The maximum likelihood tree was generated using Gubbins on the nonrecombinant regions of the whole-genome alignment comprising 96 isolates from the hyperinvasive lineage. Branch lengths in the tree were measured in substitution units. The tips of the tree were colour-coded to illustrate the collection dates of the isolates. (C) A root-to-tip linear regression analysis was conducted to assess the correlation between the root-to-tip distance and the sampling date of the isolates. The estimated clock rate, date of origin, and R2 p-value of the regression were also exhibited.

Similar articles

References

    1. Wang B, Santoreneos R, Giles L, et al. Case fatality rates of invasive meningococcal disease by serogroup and age: a systematic review and meta-analysis. Vaccine. 2019;37(21):2768–2782. doi: 10.1016/j.vaccine.2019.04.020 - DOI - PubMed
    1. van de Beek D, Brouwer MC, Koedel U, et al. Community-acquired bacterial meningitis. Lancet. 2021;398(10306):1171–1183. doi: 10.1016/S0140-6736(21)00883-7 - DOI - PubMed
    1. Caugant DA, Brynildsrud OB.. Neisseria meningitidis: using genomics to understand diversity, evolution and pathogenesis. Nat Rev Microbiol. 2020;18(2):84–96. doi: 10.1038/s41579-019-0282-6 - DOI - PubMed
    1. Hanage WP, Fraser C, Spratt BG.. Fuzzy species among recombinogenic bacteria. BMC Biol. 2005;3(1):6. doi: 10.1186/1741-7007-3-6 - DOI - PMC - PubMed
    1. Andam CP, Challagundla L, Azarian T, et al. Population structure of pathogenic bacteria. In: Tibayrenc M, editor. Genetics and evolution of infectious diseases. 2nd ed. London: Elsevier; 2017. p. 51–70.

MeSH terms