

A General Substitution Matrix for Structural Phylogenetics
- PMID: 40476610
- PMCID: PMC12198762
- DOI: 10.1093/molbev/msaf124
A General Substitution Matrix for Structural Phylogenetics
Abstract
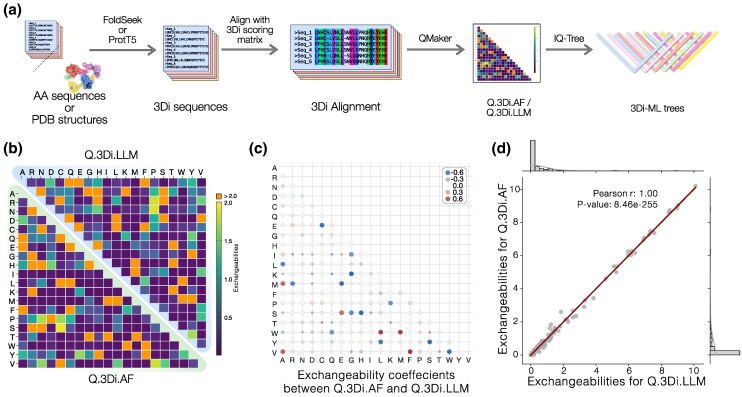
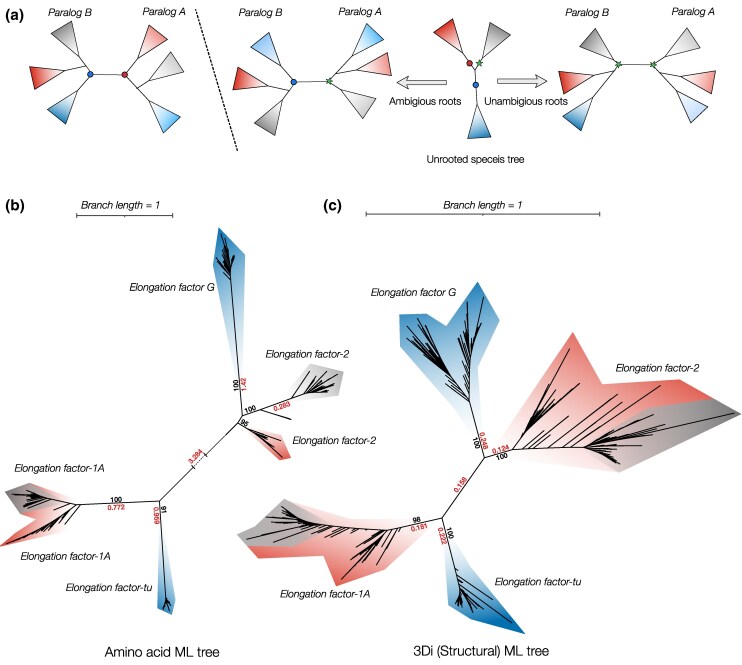
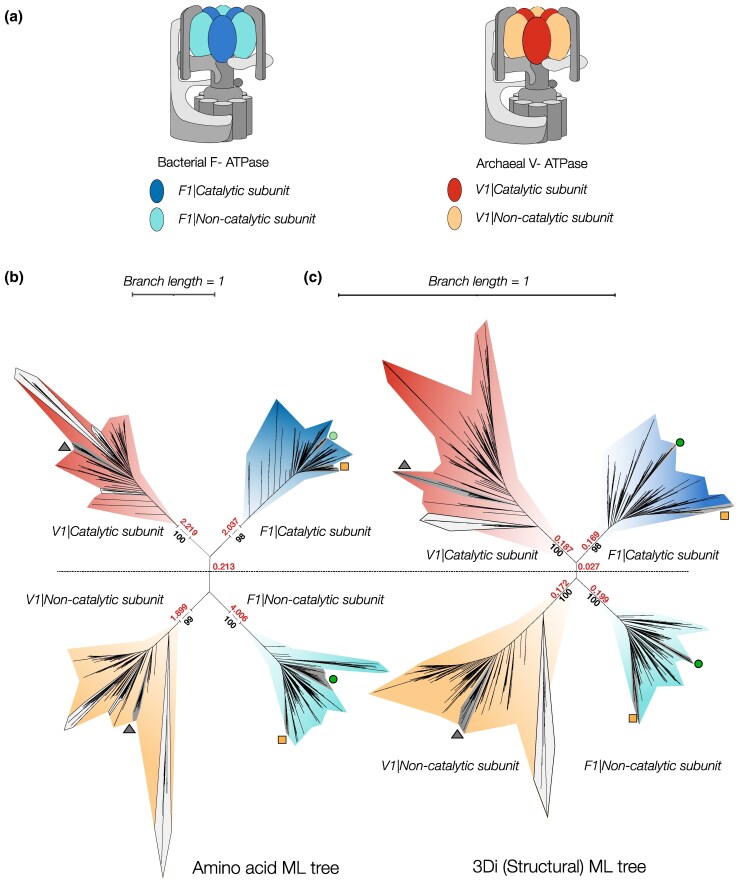
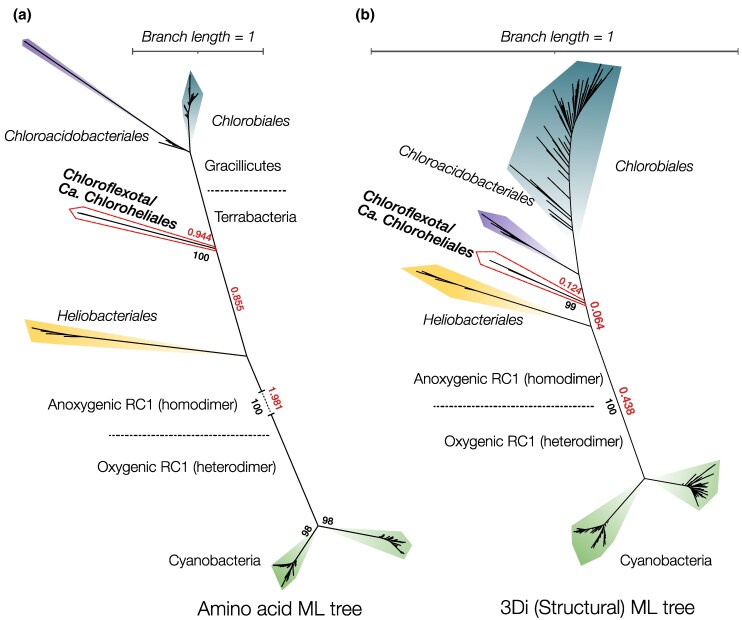
Sequence-based maximum likelihood phylogenetics is a widely used method for inferring evolutionary relationships, which has illuminated the evolutionary histories of proteins and the organisms that harbor them. However, modern implementations with sophisticated models of sequence evolution struggle to resolve deep evolutionary relationships, which can be obscured by excessive sequence divergence and substitution saturation. Structural phylogenetics has emerged as a promising alternative because protein structure evolves much more slowly than protein sequences. Recent developments in protein structure prediction using AI have made it possible to predict protein structures for entire protein families and then to translate these structures into a sequence representation-the 3Di structural alphabet-that can in theory be directly fed into existing sequence-based phylogenetic software. To unlock the full potential of this idea, however, requires the inference of a general substitution matrix for structural phylogenetics, which has so far been missing. Here, we infer this matrix from large datasets of protein structures and show that it results in a better fit to empirical datasets than previous approaches. We then use this matrix to re-visit the question of the root of the tree of life. Using structural phylogenies of universal paralogs, we provide the first unambiguous evidence for a root between archaea and bacteria. Finally, we discuss some practical and conceptual limitations of structural phylogenetics. Our 3Di substitution matrix provides a starting point for revisiting many deep phylogenetic problems that have so far been extremely difficult to solve.
Keywords: evolution; maximum likelihood; phylogenetics; structural phylogenetics; substitution models.
© The Author(s) 2025. Published by Oxford University Press on behalf of Society for Molecular Biology and Evolution.
Figures
Similar articles
-
A rapid and systematic review of the clinical effectiveness and cost-effectiveness of paclitaxel, docetaxel, gemcitabine and vinorelbine in non-small-cell lung cancer.Health Technol Assess. 2001;5(32):1-195. doi: 10.3310/hta5320. Health Technol Assess. 2001. PMID: 12065068
-
Home treatment for mental health problems: a systematic review.Health Technol Assess. 2001;5(15):1-139. doi: 10.3310/hta5150. Health Technol Assess. 2001. PMID: 11532236
-
The 2 Sigma Genus Concept in mammalogy: Lessons from Lasiurus.PLoS One. 2025 Jun 25;20(6):e0325554. doi: 10.1371/journal.pone.0325554. eCollection 2025. PLoS One. 2025. PMID: 40560834 Free PMC article.
-
Signs and symptoms to determine if a patient presenting in primary care or hospital outpatient settings has COVID-19.Cochrane Database Syst Rev. 2022 May 20;5(5):CD013665. doi: 10.1002/14651858.CD013665.pub3. Cochrane Database Syst Rev. 2022. PMID: 35593186 Free PMC article.
-
The clinical effectiveness and cost-effectiveness of enzyme replacement therapy for Gaucher's disease: a systematic review.Health Technol Assess. 2006 Jul;10(24):iii-iv, ix-136. doi: 10.3310/hta10240. Health Technol Assess. 2006. PMID: 16796930
Cited by
-
Unicore Enables Scalable and Accurate Phylogenetic Reconstruction with Structural Core Genes.Genome Biol Evol. 2025 May 30;17(6):evaf109. doi: 10.1093/gbe/evaf109. Genome Biol Evol. 2025. PMID: 40455305 Free PMC article.
-
Newly Developed Structure-Based Methods Do Not Outperform Standard Sequence-Based Methods for Large-Scale Phylogenomics.Mol Biol Evol. 2025 Jul 1;42(7):msaf149. doi: 10.1093/molbev/msaf149. Mol Biol Evol. 2025. PMID: 40580945 Free PMC article.
-
DPANN Archaea and CPR Bacteria: insights into early cellular evolution?Philos Trans R Soc Lond B Biol Sci. 2025 Aug 7;380(1931):20240096. doi: 10.1098/rstb.2024.0096. Epub 2025 Aug 7. Philos Trans R Soc Lond B Biol Sci. 2025. PMID: 40770994 Free PMC article. Review.
-
The evolutionary history and modern diversity of triterpenoid cyclases.bioRxiv [Preprint]. 2025 Aug 2:2024.10.28.620730. doi: 10.1101/2024.10.28.620730. bioRxiv. 2025. Update in: Mol Biol Evol. 2025 Aug 19:msaf203. doi: 10.1093/molbev/msaf203. PMID: 40766600 Free PMC article. Updated. Preprint.
-
Protein Structural Phylogenetics.Genome Biol Evol. 2025 Jul 30;17(8):evaf139. doi: 10.1093/gbe/evaf139. Genome Biol Evol. 2025. PMID: 40839422 Free PMC article. Review.
References
-
- Atteson K. The performance of neighbor-joining algorithms of phylogeny reconstruction. Algorithmica. 1999:25:251–278. 10.1007/PL00008277. - DOI
MeSH terms
Substances
Grants and funding
LinkOut - more resources
Full Text Sources
