. 2025 Jun 4;37(6):koaf067.
doi: 10.1093/plcell/koaf067.

Maize big embryo 6 reveals roles of plastidial and cytosolic prephenate aminotransferases in seed and plant development

Affiliations

Maize big embryo 6 reveals roles of plastidial and cytosolic prephenate aminotransferases in seed and plant development

Hui Liu et al. Plant Cell. .

Abstract

In plants, embryo size is determined via interactions between metabolic and developmental signals. Maize (Zea mays) big embryo 6 (bige6) enhances embryo size while sharply reducing plant growth. Here, we show that BigE6 encodes a plastidial prephenate aminotransferase (PPA-AT), a key enzyme in the arogenate pathway for L-phenylalanine (Phe) and L-tyrosine (Tyr) biosynthesis. The maize BigE6 paralog, BigE6Like, encodes a cytosol-localized PPA-AT, revealing Phe and Tyr biosynthesis via cytosolic arogenate as a potential alternative to the known cytosolic phenylpyruvate pathway. Moreover, the single PPA-AT gene of Arabidopsis (Arabidopsis thaliana) encodes plastidial and cytosolic enzymes by alternative splicing. Transgenic rescue of a ppa-at mutant in Arabidopsis demonstrates that the plastidial PPA-AT is indispensable for seed formation due, in part, to its essential role in the female gametophyte. Leaves of bige6 maize maintained overall homeostasis for aromatic amino acids and downstream metabolites, revealing a resilience of mechanisms that scale growth to a limiting supply of Phe and Tyr. In bige6 seeds, broad perturbation of amino acid homeostasis is associated with transcriptomic upregulation of growth processes in the embryo and endosperm, implicating amino acid signaling in the regulation of embryo size. Our findings reveal the complexity and developmental dependence of growth responses to limiting amino acid biosynthesis.


Conflict of interest statement

Conflict of interest statement. There are none to declare.

Figures

Figure 1.
Figure 1.
Genetic studies reveal alternative pathways for phenylalanine and tyrosine biosynthesis in plants. CM, chorismate mutase; PPA-AT, prephenate aminotransferase; ADT, arogenate dehydratase; ADH, arogenate dehydrogenase; PDT, prephenate dehydratase; PDH, prephenate dehydrogenase; PPY-AT, phenylpyruvate aminotransferase; HPP-AT, 4-hydroxyphenylpyruvate aminotransferase. Black arrows, reactions of the plastidial arogenate pathway; blue arrows, reactions of the cytosolic phenylpyruvate pathway; orange arrows, reactions of a proposed cytosolic arogenate pathway.
Figure 2.
Figure 2.
The bige6 mutant has pleiotropic kernel and plant phenotypes. A) Germinal views of WT (upper row) and bige6 (lower row) kernels detached from heterozygous segregating ears. Scale bar = 1 mm. B) Abgerminal views of WT (upper row) and bige6 (lower row) mature dry kernels. Scale bar = 1 mm. C) Longitudinal hand section of WT (upper row) and bige6 mutant (lower row) mature kernels. Scale bar = 1 mm. D) Fresh weights of excised embryos (left) and whole kernels (right) of WT (dark gray) and bige6 mutant (light gray) harvested at 28 DAP. Ten independent samples were measured for each genotype. E) Histological analysis of embryo scutellum of WT and bige6 mature kernels at 28 DAP. Upper panels show representative images highlighting apical, middle, and basal regions of the scutellum in embedded thin sections of WT (left) and bige6 (right) embryos. Box plots of cell size in scutellum regions of WT and bige6 embryos. At least 20 cells were counted per region. Scale bar = 100 μm. Center horizontal line indicates medians; box limits are shown with upper and lower quartiles; whiskers show 1.5 × interquartile range; points outside the plot indicated outliers. F) Anthocyanin contents of WT and bige6 mature kernels. Nine independent kernels for each genotype were used for the quantitation. DW, dry weight. G) SDS–PAGE analysis of zein proteins extracted from mature WT and bige6 kernels. Three major bands correspond to 16-, 19-, and 22-kDa zeins. H) WT and bige6 plants at time of flowering. Plants were grown from seeds that were sown on the same day. Scale bar = 20 cm. I) Phloroglucinol–HCl staining of cross sections from the 8th internode of WT (upper panel) and bige6 (lower panel) plants. Scale bar = 100 μm. J) Total lignin content of WT and bige6 8th internodes assayed using the acetyl bromide method (Moreira-Vilar et al. 2014). Three independent plants were used for each genotype. Values are means ± SE. *Differences with t test P < 0.05.
Figure 3.
Figure 3.
BigE6 and BigE6Like genes encode putative PPA-ATs. A) Gene structure of BigE6 and 3 mutant alleles. Black boxes and white boxes represent coding exons and UTRs, respectively. The black line represents introns. B) Phylogenetic tree of BIGE6 and BIGE6LIKE together with representative Ia and Ib class aspartate aminotransferases from diverse species. The tree was constructed using the maximum likelihood method in MEGA version 11 with a bootstrap value of 1,000. C) In vitro PPA-AT enzyme assays of recombinant His-tagged BIGE6 and BIGE6LIKE. Enzyme activities of BIGE6 (upper row) and BIGE6LIKE (lower row) were analyzed using L-aspartate (Asp), or L-glutamic acid (Glu) as amino donors and prephenate as acceptor substrate.
Figure 4.
Figure 4.
BIGE6 and BIGE6LIKE are localized to plastids and cytosol, respectively. A) Sequence alignment of PPA-AT N-terminal regions. B) Subcellular localization of BIGE6, truncated BIGE6 with TP removed, BIGE6LIKE, BIGE6LIKE including N-terminal TP fusion. All proteins were expressed as C-terminal GFP fusions in N. benthamiana mesophyll protoplasts. Chlorophyll autofluorescence (magenta) was used as a marker for chloroplast. Scale bars indicate 10 μm.
Figure 5.
Figure 5.
Alternative splicing variants of AtPPA-AT encode plastidial and cytosolic isoforms. A) Schematic structure of AtPPA-AT gene and 3 transcript variants detected by RT-PCR in total RNA from root. GT1, GT2, AG1, and AG2 indicate potential alternative splice sites. The translation start codons are shown in red for plastidial PPA-AT and blue for cytosolic isoforms, respectively. Purple arrows are primer pairs used for RT-PCR analysis. Positions of nucleotide positions are referred from the first start codon. Black boxes and white boxes represent coding exons and UTRs, respectively. The thin black lines between boxes represent introns. B) Alignments of splice variant DNA sequences with AtPPA-AT genomic sequence. Dotted lines indicate gaps of nucleotide sequences.
Figure 6.
Figure 6.
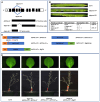
Arabidopsis ppa-at mutants generated by CRISPR/Cas9 are rescued by transgenes expressing the plastidial PPA-AT isoform, but not cytosolic PPA-AT. A) Genomic structure of WT AtPPA-AT and 2 deletion alleles of the mutants generated by CRISPR/Cas9. The asterisks indicate gRNA target sites. The lower panel shows predicted translated protein products derived from WT and 2 mutant alleles. Black boxes and white boxes represent coding exons and UTRs, respectively. The thin gray lines between boxes represent introns. B) Seed set in developing siliques of Col-0 and atppa-at heterozygotes. C) Segregation ratios of reciprocal crosses between Col-0 and atppa-at/+ parents. D) Schematic of transgenes tested for ability to rescue the atppa-at-2 mutant. All transgenes were driven by the native Arabidopsis PPA-AT promoter (1,825-bp upstream region from the translation start site). E) Leaf and plant phenotypes of atppa-at-2 plants rescued by Arabidopsis PPA-AT, AtPPA-ATnas (nonalternative splicing [nas]) and maize BigE6.
Figure 7.
Figure 7.
Metabolite profiles of bige6 leaves reveal homeostasis of aromatic amino acid biosynthesis. Free aromatic amino acids and intermediates in aromatic amino acid biosynthetic pathways were measured in 10 DPG leaves. Five biological replicates were used for quantitation of the metabolites. Quantitated values of indicated metabolites in each biological sample are shown with white circles. Mean values ± SE are reported as nmol/g per fresh weight (FW). * indicates significant differences between WT and bige6 with P < 0.05 by Student's t test.
Figure 8.
Figure 8.
Metabolite profiles of bige6 leaves reveal resilience in accumulation of specialized metabolites derived from Phe and Tyr. At least 4 biological replicates were used for quantitation of the metabolites. Quantitated values of indicated metabolites in each biological sample are shown with white circles. WT, wild type. FW, fresh weight. Data are means ± SE. * means differ at P < 0.05 based on Student's t test.
Figure 9.
Figure 9.
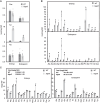
The bige6 mutant perturbs amino acid homeostasis in the embryo and endosperm. Amino acid profiles were analyzed in mutant and WT embryos and endosperms harvested from self-pollinated ears segregating bige6 at 24 DAP. DW, dry weight. A) Comparison of free aromatic amino acid levels in embryo and endosperm between WT and bige6. Comparison of free amino acids (B) and PBAAs (C) in embryo and endosperm between WT and bige6. Four biological replicates were used for these analyses. Quantitated values of indicated metabolites in each biological sample are shown with white circles. Data are means ± SE. *P < 0.05, Student's t test.
Figure 10.
Figure 10.
The bige6 mutant alters expression of genes in key amino acid biosynthetic and catabolic pathways in embryo and endosperm. DEGs with functions in amino acid biosynthesis and catabolism pathways were identified (FDR 0.05) in transcriptomes of bige6 and WT embryo and endosperm sampled at 20 DAP with 3 biological replicates from segregating ears of self-pollinated heterozygotes. To enable comparison of the relative contributions of gene family members, log2 of fold change (Log2FC) values of DEGs (red, upregulated; blue, downregulated) and paralogs that encode the same enzyme are shown together with FPKM values of WT. DEGs with >1.5-fold change are marked with asterisks. ND, not determined because the divisor is 0.

Similar articles

Cited by

References

    1. Block A, Fristedt R, Rogers S, Kumar J, Barnes B, Barnes J, Elowsky CG, Wamboldt Y, Mackenzie SA, Redding K, et al. Functional modeling identifies paralogous solanesyl-diphosphate synthases that assemble the side chain of plastoquinone-9 in plastids. J Biol Chem. 2013:288(38):27594–27606. 10.1074/jbc.M113.492769 - DOI - PMC - PubMed
    1. Boehlein SK, Shaw JR, Boehlein TJ, Boehlein EC, Hannah LC. Fundamental differences in starch synthesis in the maize leaf, embryo, ovary and endosperm. Plant J. 2018:96(3):595–606. 10.1111/tpj.14053 - DOI - PubMed
    1. Bonawitz ND, Chapple C. The genetics of lignin biosynthesis: connecting genotype to phenotype. Annu Rev Genet. 2010:44:337–363. 10.1146/annurev-genet-102209-163508 - DOI - PubMed
    1. Bross CD, Howes TR, Abolhassani Rad S, Kljakic O, Kohalmi SE. Subcellular localization of Arabidopsis arogenate dehydratases suggests novel and non-enzymatic roles. J Exp Bot. 2017:68(7):1425–1440. 10.1093/jxb/erx024 - DOI - PMC - PubMed
    1. Chen J, Zeng B, Zhang M, Xie SJ, Wang GK, Hauck A, Lai JS. Dynamic transcriptome landscape of maize embryo and endosperm development. Plant Physiol. 2014:166(1):252–264. 10.1104/pp.114.240689 - DOI - PMC - PubMed

MeSH terms

LinkOut - more resources